
Rivian Automotive (NASDAQ: RIVN) — Its $176 Million Gross Profit Didn’t Come From Trucks. Is the Turnaround Real?
What Rivian Builds — and What It Actually Sells
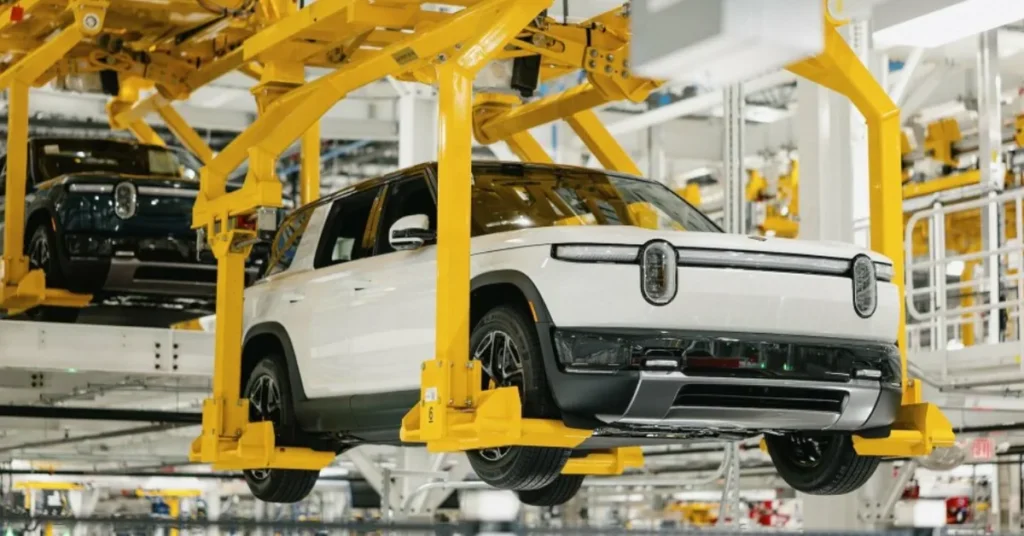
Rivian Automotive (RIVN) designs and manufactures electric vehicles at a single plant in Normal, Illinois, with a second facility under construction in Georgia. The product line has three parts. The R1T pickup and R1S SUV are the original premium vehicles, priced in the $70,000–$100,000 range. The R2 is the mid-size SUV launched into volume production this year at a materially lower price point. And the Electric Delivery Van (EDV) is the commercial vehicle built originally under an exclusivity arrangement with Amazon.
In the third quarter of 2026, the R2 became the best-selling vehicle in the portfolio in its first full quarter of deliveries, outselling both the R1 line and the EDV. The company produced 19,751 vehicles and delivered 19,248.
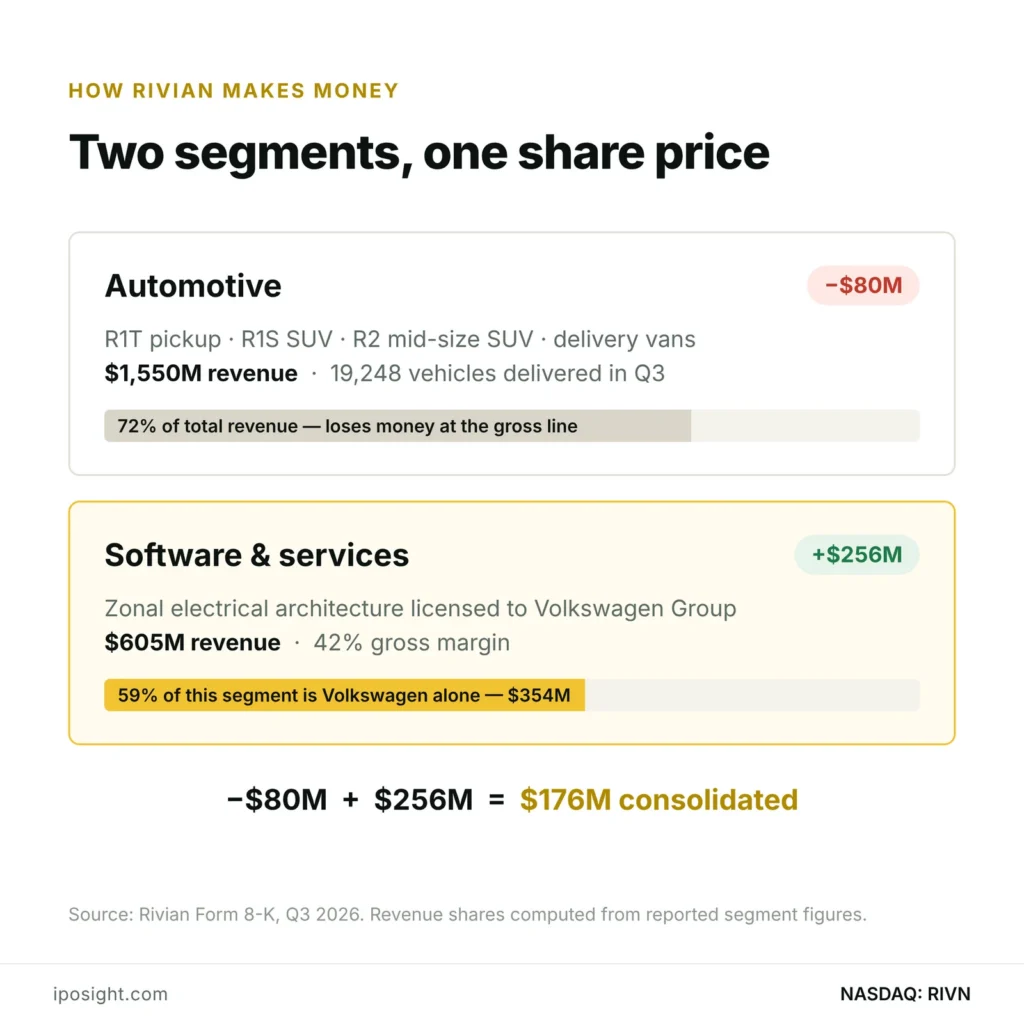
But Rivian is not only a vehicle manufacturer, and this is the part that matters for reading the financials. The company runs a second reporting segment called software and services, which includes its joint venture with Volkswagen Group — an arrangement under which Rivian licenses its zonal electrical architecture and software stack to Volkswagen for use in Volkswagen’s own vehicles. In Q3 2026 that segment produced $605 million of revenue, up 45% year over year, of which $354 million was attributable to the Volkswagen joint venture.
Two businesses, then: one that builds vehicles, and one that sells the electronics and software that go inside vehicles — including somebody else’s.
The Numbers in Q3 2026
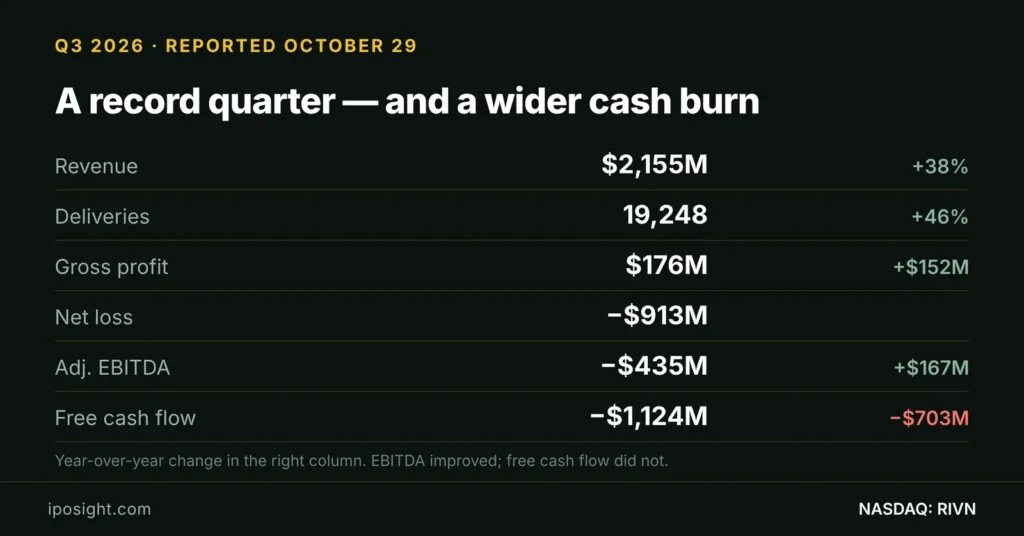
Rivian reported on October 29, 2026, and beat on both headline lines. Revenue of $2.155 billion came in above the $2.023 billion consensus. The adjusted loss per share of $0.48 was narrower than the $0.64 analysts expected. The company raised full-year delivery guidance to 67,000–70,000 vehicles from a prior floor of 65,000, improved its adjusted EBITDA guidance to a loss of $1.75–1.85 billion, and cut planned capital expenditure to $1.40–1.50 billion.
The quarter in full:
- Consolidated revenue: $2.155 billion, up 38% year over year
- Automotive revenue: $1.550 billion, up 36%
- Software and services revenue: $605 million, up 45%
- Consolidated gross profit: $176 million, an 8% margin, against $24 million a year earlier
- Net loss: $913 million
- Adjusted EBITDA: −$435 million, against −$602 million a year earlier
- Free cash flow: −$1.124 billion, against −$421 million a year earlier
- Capital expenditure: $366 million in the quarter
Note the direction of the last two lines. Adjusted EBITDA improved by $167 million year over year. Free cash flow deteriorated by $703 million over the same comparison. Those move in opposite directions because the R2 ramp is being paid for in working capital and tooling, which EBITDA does not see.
Where the $176 Million Gross Profit Actually Came From
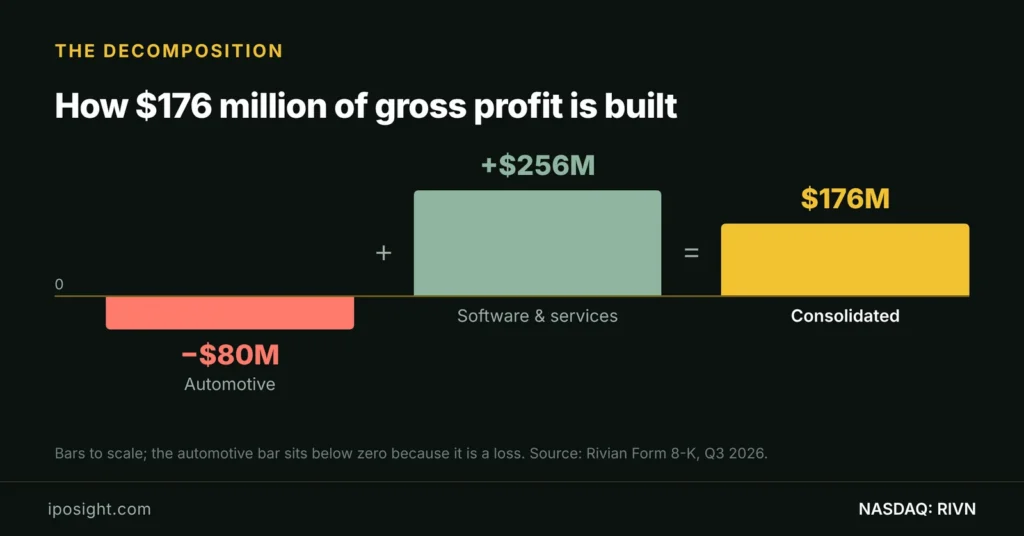
This is our own computation, and it takes one line of arithmetic from the company’s own 8-K.
Consolidated gross profit was $176 million. The filing breaks that into its two reporting segments:
- Automotive segment gross result: −$80 million (a loss)
- Software and services gross result: +$256 million, at a 42% margin
$256 million minus $80 million is $176 million. The entire consolidated gross profit — and $80 million more besides — came from the software and services segment. The vehicle business, after five years of production and at a record quarterly volume, still costs more to build than it sells for at the gross line, before a dollar of research, selling or administrative expense is counted.
Rivian did not report a gross profit on vehicles in Q3 2026. It reported a gross profit on software. The automotive segment lost $80 million at the gross line in the same quarter the company called its best. The coverage that described positive gross profit as an automotive milestone was describing a consolidated number that the automotive segment pulled downward.
Go one layer further. Of the $605 million of software and services revenue, $354 million — 59% of the segment — was attributable to the Volkswagen Group joint venture. That is 16.4% of Rivian’s total consolidated revenue coming from a single commercial relationship, and it sits inside the only segment currently producing a gross profit.
Management is explicit about where this goes next. On the earnings call the company said it expects to exit 2026 with a positive automotive gross margin run rate, while also saying it does not expect a full quarter of positive automotive gross profit. Those two statements together describe a crossover that has not happened yet and is expected to happen at the very edge of the year. The $120 million of incremental R2 ramp costs recognised in cost of revenue during Q3 is the reason it has not happened already — and also the reason it plausibly could.
Why Did Rivian Stock Fall From $106.75 to $12.18?
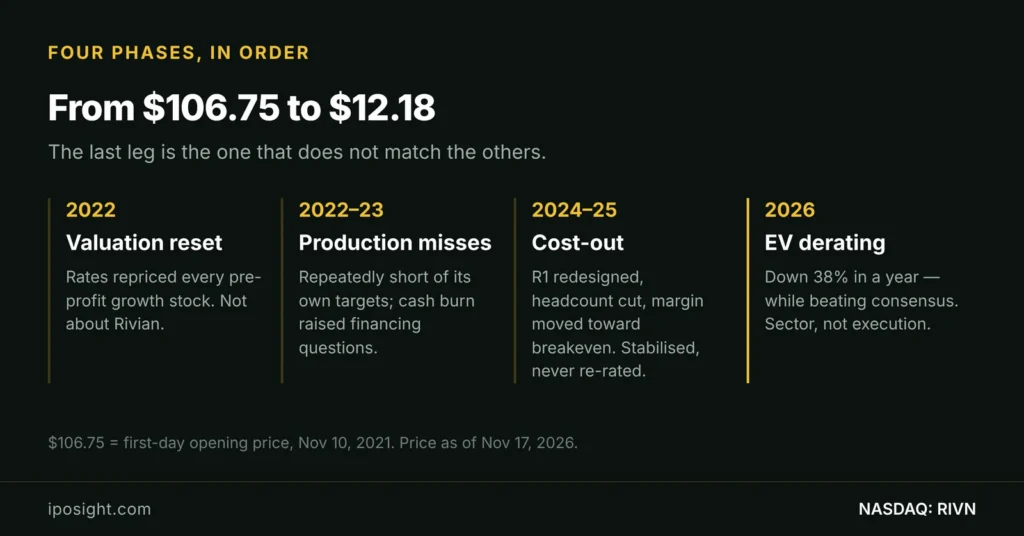
Rivian listed on November 10, 2021 at an offer price of $78 per share, raising close to $12 billion and valuing the company at roughly $66.5 billion. It opened at $106.75 and traded above $170 within days, briefly making it worth more than Ford and General Motors combined, on deliveries that at the time numbered in the hundreds.
The decline from there was not one event. It arrived in four distinct phases, and the order matters:
- The valuation reset (2022). The entire pre-profit growth cohort repriced as interest rates rose. Rivian’s fall in this phase was about the discount rate applied to distant cash flows, not about Rivian.
- The production reality (2022–2023). Rivian repeatedly missed its own production targets and burned cash at a rate that raised financing questions. The market stopped paying for the 2021 story and started pricing the factory.
- The cost-out phase (2024–2025). Rivian redesigned the R1 platform to strip cost, cut headcount, and moved gross margin from deeply negative toward breakeven. The stock stabilised but did not re-rate, because the volume that would make the fixed-cost base work was still a product cycle away.
- The EV demand derating (2026). The most recent leg is sector-wide. Rivian is down 38.2% over twelve months and 18.1% over the past quarter, and the company’s own quarter was good. This is the market marking down the addressable EV market, not Rivian’s execution within it.
That fourth phase is why the current setup is unusual. In the first three phases the share price fell because Rivian underdelivered. In the fourth it has fallen while Rivian overdelivered against consensus on both headline lines.
Offer Price or Opening Price? The Four-Point Gap in Every IPO Statistic
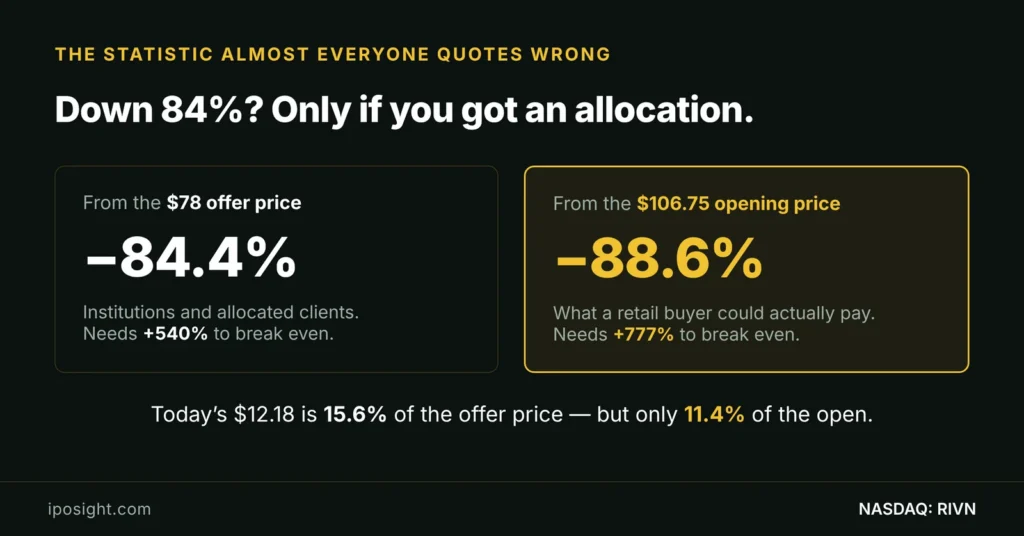
Almost every statistic you will read says Rivian is down about 84% since its IPO. That number measures from the $78 offer price — the price paid by the institutions and favoured clients who received an allocation in the book. It is the correct number for them.
It is the wrong number for nearly everyone else. The first price available on the open market was $106.75. Measured from there, Rivian stock is down 88.6%, and today’s $12.18 is 11.4% of what a retail buyer paid on day one, not 15.6%.
Four and a half percentage points does not sound like much until you invert it. The investor who bought at the offer needs a 540% gain to break even. The investor who bought at the open needs 777%. That is the difference the standard statistic hides, and it is structural, not specific to Rivian — it exists in every IPO that opened above its offer price, which is most of them. We track both figures separately on the Price Tracker for exactly this reason.
Customer Concentration: One Partner, 59% of a Segment
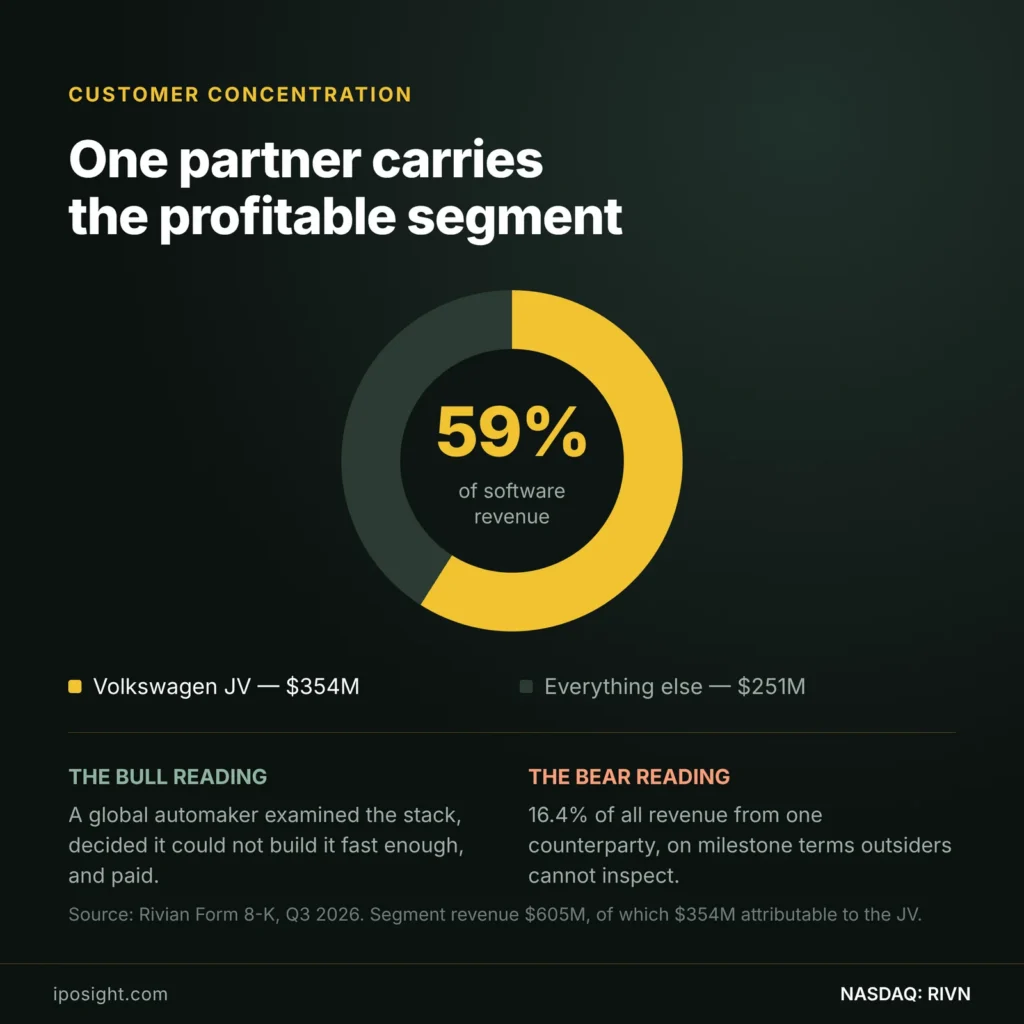
The Volkswagen relationship is the most important commercial fact about Rivian today, and it cuts both ways.
Volkswagen Group and Rivian formed a joint venture to develop and deploy Rivian’s zonal electrical architecture and software stack in Volkswagen vehicles. In Q3 2026 that relationship produced $354 million of revenue inside a segment that reported a 42% gross margin — by far the most profitable revenue Rivian books. In October 2026 Volkswagen also extended Rivian a $1.000 billion non-recourse term loan, which lifts pro forma total liquidity to $7.095 billion.
The bull reading: a global automaker with its own very large engineering organisation examined Rivian’s software, concluded it could not build the equivalent fast enough itself, and paid for access. That is external validation of the asset that Rivian’s own hardware business has not yet monetised, and it is the single strongest evidence that Rivian’s technology has standalone value.
The bear reading: 16.4% of consolidated revenue and the majority of the only profitable segment depend on one counterparty, under contractual terms the public cannot inspect in detail. Joint-venture revenue of this kind is typically tied to development milestones and programme launches, which means it is lumpy by nature and not automatically recurring. If the programme schedule slips, the line that currently carries Rivian’s entire gross profit moves with it.
Neither reading is available for verification at the level that would settle it. The public filings disclose the revenue attributable to the joint venture and the loan, not the milestone schedule or the duration of the licensing commitment. Any projection of software and services revenue beyond the next few quarters is an assumption, and should be labelled as one.
Cash, Burn, and How Long the Runway Lasts
Rivian ended the third quarter with $5.502 billion in cash, cash equivalents and short-term investments, and total liquidity of $6.095 billion including revolving credit capacity. Adding the $1.000 billion Volkswagen term loan received in October gives pro forma total liquidity of $7.095 billion.
Against that, free cash flow in Q3 was −$1.124 billion. Held flat — which it will not be, in either direction — that is 4.9 quarters of cash and short-term investments, or 6.3 quarters of pro forma liquidity. Call it somewhere between five and seven quarters at the current rate. (Derived figure: pro forma liquidity divided by the single most recent quarter’s free cash flow. It is a crude measure and deliberately so; it is not a company forecast.)
Two things make the real number better than that arithmetic. Capital expenditure guidance for the full year was cut to $1.40–1.50 billion, and the R2 ramp costs of $120 million recognised in Q3 are, by definition, ramp costs — they decline as the line reaches rate. Two things make it worse. The Georgia facility is still ahead, and a company that is not yet gross-profitable on vehicles cannot fund growth from operations.
The balance sheet carries a current ratio of 2.18 and a debt-to-equity ratio of 95.4. Neither is a distress signal. Rivian is not in danger of running out of money in the next four quarters; it is in a position where the length of the ramp and the cost of the next financing are the same question.
How Big Is the Market?
Rivian competes in two US segments that are large and one that is not yet proven.
The large ones are mid-size SUVs and pickups, which together account for the majority of US light-vehicle sales. The R2 is Rivian’s first product aimed squarely at the first of these, and its immediate ascent to best-seller within Rivian’s own line-up in a single quarter is the most useful demand signal the company has produced in years — it says the price point, not the brand, was the binding constraint.
The segment that is not yet proven is Rivian’s electrical architecture as a licensed product. One customer exists. Whether there is a second is the difference between a business and a contract, and nothing in the public record answers it.
Working against all of this is the direction of US electric-vehicle demand in 2026. Growth rates across the industry have slowed from the 2021–2023 trajectory, policy support has become less predictable, and the market has repriced the entire category — which is why Rivian’s stock is down 38.2% over a year in which its revenue grew 38% in the latest quarter.
The Real Competitive Landscape
Rivian’s competition is not the one the 2021 narrative described.
In pickups and large SUVs, the direct rivals are Tesla (TSLA), Ford (F) with the F-150 Lightning, and General Motors (GM). All three have a cost base, dealer network and balance sheet Rivian does not. In the mid-size segment the R2 enters, the competitive field widens to include essentially every manufacturer selling an electric SUV in the United States.
Among the standalone EV startups, Lucid (LCID) is the closest comparison in business model and the most instructive in outcome. Rivian’s advantage over that cohort is volume: it is delivering roughly 19,000 vehicles a quarter and its newest product is already its best-seller, which is a different operational situation from most of the companies that listed alongside it.
On the software side the competitive set is different again, and it is one where Rivian has a demonstrated win. The companies that sell vehicle electrical architecture and software to other automakers are mostly tier-one suppliers. Volkswagen chose Rivian over building it internally. That is one data point, but it is a real one.
Leadership, Ownership and Who Actually Holds Rivian Stock
Rivian was founded by RJ Scaringe, who remains chief executive. The company is not founder-controlled through a dual-class structure in the way several of its listing cohort are; influence sits with its strategic holders.
Amazon is the largest disclosed institutional holder, a position originating in the pre-IPO investment tied to the delivery-van programme. Porsche Automobil Holding SE and Abdul Latif Jameel are among the other large strategic holders, alongside index and active managers including Vanguard, BlackRock and Baillie Gifford. Volkswagen Group is a commercial partner and now a lender rather than a conventional equity holder.
Two implications follow. First, a substantial share of the register is held by parties whose interest in Rivian is strategic rather than financial, which reduces the free float that trades on quarterly results. Second, the share count has grown materially since listing — our derived figure from the current $17.78 billion market capitalisation at $12.18 is roughly 1.46 billion shares, against a float of approximately 1.0 billion at the time of the IPO. (Share count derived from market capitalisation divided by price, not a reported figure.) Dilution has been a real component of the per-share decline, distinct from the fall in enterprise value.
On the fund side, Rivian is held across several hundred ETFs, predominantly broad-market, Nasdaq-tracking and clean-energy or innovation-themed products. For most investors the practical point is that index exposure to Rivian is incidental and small; there is no major ETF for which Rivian is a defining position. We map institutional and fund ownership for listed IPO-cohort names on Who Holds It.
What the $17.94 Consensus Target Actually Contains
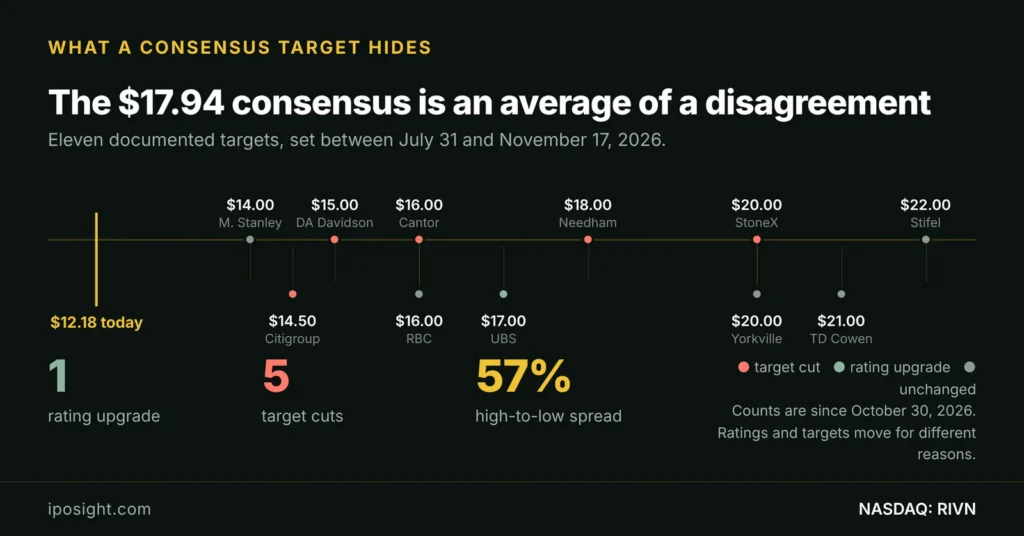
Twenty-five analysts cover Rivian. Fourteen rate it Buy, six Hold and five Sell, producing a consensus of Buy and a mean price target of $17.94 — 47.3% above the current $12.18. Taken at face value, that is a strong signal: the professionals who follow this company closely think it is worth half again what it trades for.
Taken apart, it is a less unified picture. Here is every target change we could document since late July, with the date each one was set:
| Date | House | Rating | Target | Change |
|---|---|---|---|---|
| Jul 31, 2026 | Morgan Stanley | Underweight | $14.00 | raised from $13 |
| Jul 31, 2026 | RBC | Sector Perform | $16.00 | raised from $14 |
| Jul 31, 2026 | TD Cowen | Buy | $21.00 | raised from $20 |
| Oct 6, 2026 | Yorkville Ives | Outperform | $20.00 | initiated |
| Oct 30, 2026 | Needham | Buy | $18.00 | cut from $23 |
| Oct 30, 2026 | Cantor Fitzgerald | Neutral | $16.00 | cut from $19 |
| Nov 2, 2026 | UBS | Buy | $17.00 | upgraded from Neutral |
| Nov 6, 2026 | DA Davidson | Neutral | $15.00 | cut from $17 |
| Nov 9, 2026 | Stifel | Buy | $22.00 | maintained |
| Nov 10, 2026 | Citigroup | Neutral | $14.50 | cut from $18 |
| Nov 17, 2026 | StoneX | Buy | $20.00 | cut from $25 |
Three things fall out of that table that the single consensus number does not show.
One rating went up; five numbers came down. Since October 30 there has been exactly one rating upgrade — UBS, on November 2, from Neutral to Buy — and five separate price-target cuts, from Needham, Cantor Fitzgerald, DA Davidson, Citigroup and StoneX. The ratings are improving and the valuations attached to them are falling at the same time. That is not a contradiction: an analyst who thinks a stock is cheaper than it was can raise the rating while lowering the target. But it means “consensus Buy with 47% upside” describes two different movements as one.
The upgrade came with no new number. UBS analyst Joseph Spak moved Rivian from Neutral to Buy while leaving his $17 target unchanged, citing valuation after the sell-off and the R2 ramp. The rating changed because the price fell, not because the forecast rose. The stock gained 8.5% that day.
The spread is 57%. The lowest documented target is Morgan Stanley’s $14.00 and the highest is Stifel’s $22.00 — a 57% gap between the two, with both houses looking at the same filings. Two of the three most recent targets, Citigroup’s $14.50 and DA Davidson’s $15.00, sit below the $17.94 mean. A consensus with that dispersion is not a forecast; it is a disagreement with an average printed on top of it.
How to read any consensus target in 30 seconds. (1) Find the date of the oldest target in the average — anything older than the last earnings release is pre-information. (2) Count rating changes and target changes separately; they move for different reasons. (3) Look at the high–low spread, not the mean: a spread above about 40% means the analysts disagree on the business, not the price. (4) Check whether the most recent targets sit above or below the mean — that tells you which way the average is about to drift. We apply this method weekly in Analyst Ratings.
The Biggest Risks
- The automotive gross crossover does not arrive. Management expects a positive automotive gross margin run rate at the exit of 2026 but explicitly not a full positive quarter. If the crossover slips past the first half of 2027, the central bull argument slips with it.
- Volkswagen concentration. $354 million of quarterly revenue, 59% of the only profitable segment, from one counterparty on undisclosed milestone terms.
- Cash burn against a finite runway. Free cash flow of −$1.124 billion in a single quarter against $7.095 billion of pro forma liquidity. Roughly five to seven quarters at that rate, and the Georgia plant still ahead.
- Sector demand, not company execution. Rivian beat consensus and the stock is down 18.1% over the quarter. A company cannot execute its way out of a derating of its entire category.
- Dilution. Share count has grown from roughly 1.0 billion at IPO to a derived 1.46 billion today. Every future financing that is not debt costs existing holders proportionally.
- Competition arriving at the R2’s price point. The R2’s early success proves the price point works. That is also an invitation.
Bulls and Bears
- Revenue grew 38% and deliveries 46% in a quarter when the sector was shrinking; the R2 became the best-selling vehicle in the line-up in its first full quarter.
- Consolidated gross profit improved $152 million year over year, and adjusted EBITDA loss narrowed by $167 million.
- Volkswagen paid for the software stack and then lent the company $1 billion, which is a strategic partner’s vote in two different currencies.
- At $17.78 billion market capitalisation and 2.7× trailing sales, the price embeds a substantial probability that none of this works.
- Guidance was raised across deliveries and EBITDA while capex was cut — an unusual combination.
- The automotive segment still loses money at the gross line — $80 million in the best quarter the company has had.
- Free cash flow deteriorated to −$1.124 billion from −$421 million a year earlier; the ramp is being funded, not self-financing.
- The only profitable segment depends on one partner for 59% of its revenue, on terms outsiders cannot inspect.
- Five price-target cuts in under three weeks, including two below the consensus mean.
- US EV demand growth has slowed and policy support is less predictable than when the capital plan was set.
Is Rivian Stock a Good Investment at $12.18?
The question splits cleanly into two, and conflating them is what produces most of the bad analysis on this company.
Is the business improving? Measurably and in the right direction. Revenue +38%, deliveries +46%, consolidated gross profit up $152 million year over year, adjusted EBITDA loss narrowed by $167 million, guidance raised while capex was cut, and the new volume product became the best-seller in its first full quarter. That is not a company in decline. Every one of those numbers comes from the company’s own filing and is checkable.
Is the valuation attractive? That depends entirely on a crossover that has not happened. At $17.78 billion and 2.7× trailing sales, Rivian is priced neither as a successful automaker nor as a failure. It is priced as a company whose core product line does not yet make a gross profit, which is factually what it is. The automotive segment’s −$80 million is the single number that has to change sign, and management has guided to it happening at the very end of this year as a run rate rather than as a reported quarter.
What the price does embed is that the company does not have a going-concern problem. $7.095 billion of pro forma liquidity, a 2.18 current ratio, and a strategic lender that just wrote a billion-dollar cheque do not describe a company the market expects to fail. The debate is about the slope of the ramp, not survival.
Is Multi-Year Appreciation Sustainable?
Rivian has not appreciated; it has fallen 84.4% from its offer price and 88.6% from its first trade. The relevant question is not whether a run can continue but whether a floor is in.
Three conditions would need to hold for a durable multi-year re-rating, and they are sequential rather than parallel. First, automotive gross profit has to turn positive and stay positive through a full quarter, not as an exit run rate. Second, the R2 has to scale from roughly 19,000 total quarterly deliveries to a volume where the fixed-cost base is absorbed, without the per-unit economics degrading as the mix shifts toward a cheaper vehicle — the mix shift is the under-discussed risk in the bull case. Third, software and services has to prove it is a business rather than one contract, which requires a second customer that does not currently exist publicly.
The first condition is close and credible. The second is a 2027–2028 question. The third has no visible timeline. An investor assuming all three is making three independent bets, not one.
12-Month Price Scenario Analysis
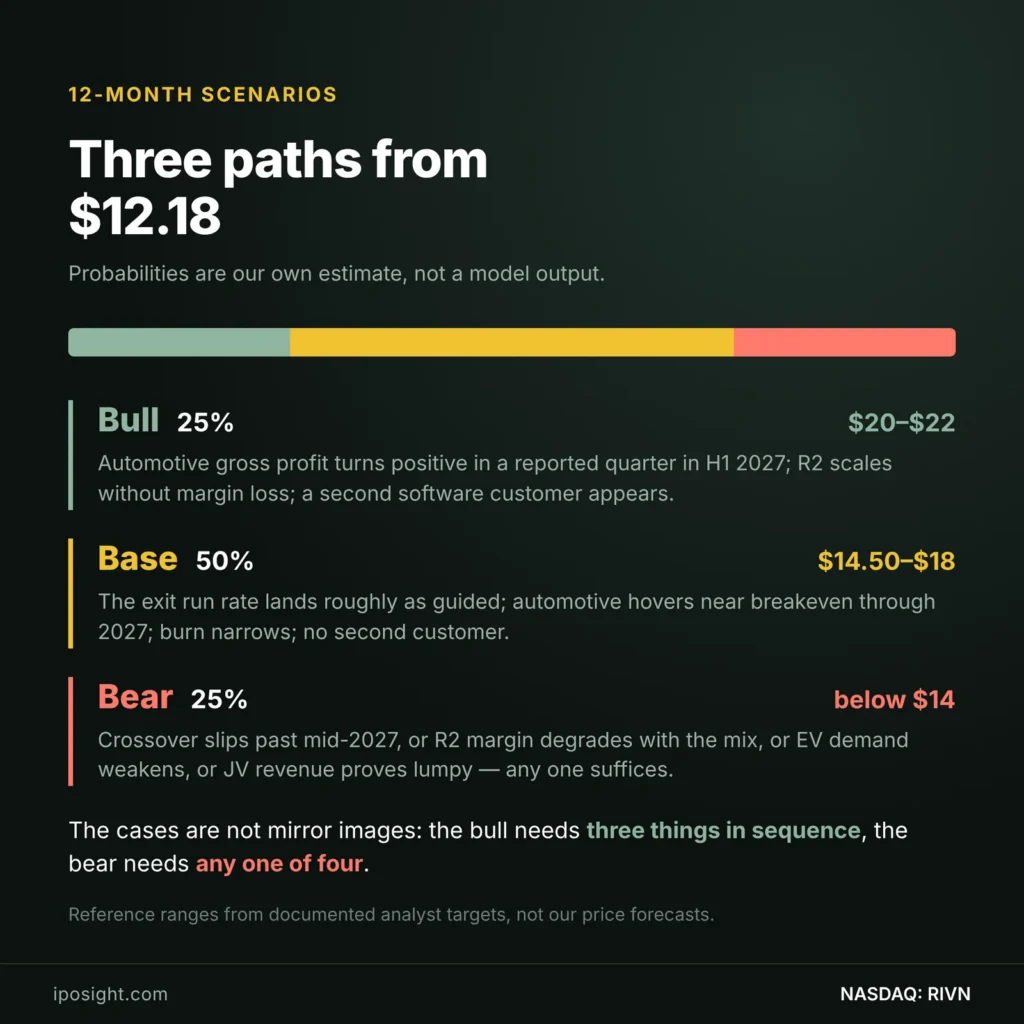
The scenarios below are built from the published guidance, the segment economics above, and the documented analyst target range. Probabilities are our own judgement and are labelled as estimates, not forecasts.
| Scenario | Probability | What has to happen | Reference range |
|---|---|---|---|
| Bull | 25% | Automotive gross profit turns positive in a reported quarter during H1 2027; R2 volumes continue climbing without margin degradation; a second software customer is announced or the Volkswagen programme expands. | Toward the upper documented target band ($20–$22) |
| Base | 50% | The exit run rate arrives roughly as guided; automotive gross profit hovers near breakeven through 2027; free cash flow stays negative but narrows as ramp costs roll off; no second software customer. | Within the clustered target band ($14.50–$18) |
| Bear | 25% | The crossover slips past mid-2027, or R2 margin degrades with the mix, or EV demand weakens further, or Volkswagen programme revenue proves lumpier than the run rate implies — any one is sufficient; a dilutive financing follows. | Below the lowest documented target ($14.00) |
The asymmetry worth noting is that the bull and bear cases are not mirror images. The bull case requires three things to go right in sequence. The bear case requires any one of four things to go wrong. That is the structural shape of a pre-profitability industrial ramp, and it is why the analyst spread is 57% wide.
Investment Evaluation
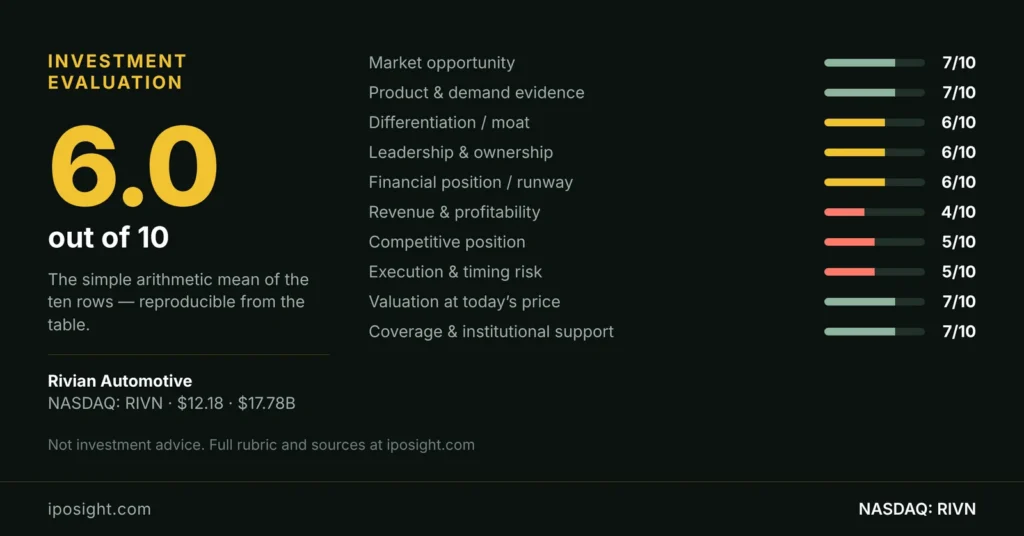
| Factor | Score |
|---|---|
| Market opportunity — US SUV and pickup segments
The R2 targets the largest US vehicle segment, and its immediate rise to best-seller shows the price point, not the brand, was the constraint. Offsetting this: US EV demand growth has slowed sector-wide in 2026.
|
7/10 |
| Product quality and demand evidence
19,248 deliveries in Q3, up 46% year over year, with R2 outselling both R1 and the delivery van in its first full quarter. This is the strongest demand datapoint Rivian has produced since listing.
|
7/10 |
| Differentiation and moat
The zonal electrical architecture is genuinely differentiated — Volkswagen paid for access rather than building it. The vehicle hardware itself is replicable by any established manufacturer.
|
6/10 |
| Leadership and ownership structure
Founder-led, with Amazon, Porsche SE and Abdul Latif Jameel as strategic holders and Volkswagen as partner and lender. Share count has grown from roughly 1.0bn at IPO to a derived 1.46bn today.
|
6/10 |
| Financial position and runway
$5.502bn cash and short-term investments, $7.095bn pro forma liquidity, 2.18 current ratio. At the Q3 free cash flow rate of −$1.124bn that is roughly five to seven quarters. Not distress; not comfort either.
|
6/10 |
| Revenue and profitability
Revenue +38% to $2.155bn, but a $913m net loss and an $80m automotive gross loss. Trailing twelve-month net margin is −45.9%. The gross crossover on vehicles has not occurred.
|
4/10 |
| Competitive position
Competing against Tesla, Ford and GM in pickups and against essentially every manufacturer in the mid-size segment the R2 enters, without their cost base or dealer network. Stronger than the startup cohort on volume.
|
5/10 |
| Execution and timing risk
Guidance was raised and capex cut, which is a good sign on execution. But free cash flow deteriorated to −$1.124bn from −$421m, and $120m of R2 ramp costs hit cost of revenue in the quarter.
|
5/10 |
| Valuation at today’s price
$17.78bn market capitalisation at 2.7× trailing sales, with the stock at 11.4% of its first-day opening price. The price embeds substantial probability of failure in a company with $7.1bn of liquidity.
|
7/10 |
| Analyst coverage and institutional support
25 analysts with 14 Buy ratings, several hundred ETFs holding the stock, and strategic holders including Amazon and Porsche SE. Offsetting: five target cuts in under three weeks and a 57% spread between high and low.
|
7/10 |
Overall Investment Score: 6.0 / 10 — the simple arithmetic mean of the ten rows above, to one decimal. Every input is visible in the table and the calculation is reproducible; see our method.
Final Verdict
What is factually good is not in dispute and does not require interpretation. Revenue grew 38% to $2.155 billion in a quarter when the electric-vehicle category was derating. Deliveries grew 46%. Consolidated gross profit improved by $152 million year over year to $176 million, against a $39 million consensus. Adjusted EBITDA loss narrowed by $167 million. The R2 became Rivian’s best-selling vehicle in its first full quarter of deliveries, which answers the single most important open question about the company — whether demand existed below the R1’s price point. Management raised delivery and EBITDA guidance while cutting capital expenditure, a combination that rarely appears together. And Volkswagen, having already licensed Rivian’s software, lent it a further $1 billion in October.
For Rivian stock to work from $12.18, three things have to hold, in order. (1) The automotive segment has to stop losing money at the gross line — not as an exit run rate in the last weeks of December, which is what has been guided, but as a reported quarter, which has not. (2) R2 volumes have to keep climbing without the per-unit economics degrading as the mix shifts toward a cheaper vehicle, which is the quiet risk inside the most celebrated part of this quarter. (3) Software and services has to acquire a second customer, because a segment that carries the company’s entire gross profit while drawing 59% of its revenue from one partner is a contract, not yet a business. The first is close. The second is a 2027 question. The third has no public timeline at all.
The bear case is not that Rivian fails. With $7.095 billion of pro forma liquidity, a 2.18 current ratio and a strategic lender writing billion-dollar cheques, near-term solvency is not the argument. The bear case is that the crossover keeps arriving next quarter: that free cash flow of −$1.124 billion against a $1 billion loan is a treadmill rather than a bridge, that each ramp is followed by another plant and another ramp, and that dilution grinds the per-share value down even as enterprise value stabilises. The share count going from roughly 1.0 billion at IPO to a derived 1.46 billion today is what that looks like in practice. That is a slower and less dramatic failure than bankruptcy, and historically a more common one.
The most honest summary of Rivian today is that it is two companies with one share price. One of them builds vehicles at record volume and still loses money on every gross-line dollar of them. The other licenses electrical architecture to a German automaker at a 42% margin and carries the whole consolidated result on its back. The market is pricing the first and the filings are being carried by the second, and until the automotive segment turns positive for a full reported quarter, anyone arguing about whether $12.18 is cheap is really arguing about how long that arrangement can last.
What These Numbers Do Not Tell You
The segment disclosure gives the revenue attributable to the Volkswagen joint venture but not the contract’s duration, milestone schedule or renewal terms — so the durability of the only profitable segment cannot be assessed from public filings. The $176 million consolidated gross profit is a reported figure, but the allocation of shared costs between segments is a management judgement that outsiders cannot audit. The runway calculation uses a single quarter’s free cash flow, which included non-recurring ramp costs and will not repeat exactly. The 1.46 billion share count is derived from market capitalisation and price, not read from a filing. And the probabilities in the scenario table are our estimates, not the output of a model.
Frequently Asked Questions
Why is Rivian stock down so much since its IPO?
Rivian listed at $78 in November 2021 and opened at $106.75, valuing a company then delivering vehicles in the hundreds at over $66 billion. The decline came in four phases: the 2022 rate-driven repricing of all pre-profit growth stocks, repeated production misses in 2022–2023, a cost-out period in 2024–2025 that stabilised margins without re-rating the stock, and a sector-wide electric-vehicle derating in 2026 that has continued even as Rivian’s own results improved.
Did Rivian actually make a profit in Q3 2026?
No. Rivian reported a consolidated gross profit of $176 million and a net loss of $913 million. The gross profit came entirely from the software and services segment, which earned $256 million; the automotive segment lost $80 million at the gross line.
How much of Rivian’s revenue comes from Volkswagen?
In Q3 2026, $354 million was attributable to the Volkswagen Group joint venture — 59% of software and services revenue and 16.4% of total consolidated revenue. Volkswagen also provided a $1 billion non-recourse term loan in October 2026.
How long can Rivian fund itself?
Rivian ended Q3 with $5.502 billion in cash and short-term investments and $7.095 billion in pro forma total liquidity including the Volkswagen loan. At the Q3 free cash flow rate of −$1.124 billion, that is roughly five to seven quarters — a derived figure, not a company forecast, and one that ignores both declining ramp costs and future plant spending.
What is the analyst price target for Rivian?
The mean of 25 analysts is $17.94, 47.3% above the current price, with a consensus rating of Buy. The documented individual targets range from $14.00 to $22.00 — a 57% spread. Since October 30 there has been one rating upgrade and five price-target cuts.
When is the next Rivian event?
Rivian has named an Autonomy and AI Day for December 9, 2026, ahead of full-year delivery results against guidance of 67,000–70,000 vehicles.
Methodology
Share price of $12.18, market capitalisation of $17,778 million, analyst counts, consensus rating and the $17.94 mean target are from the IPO Portfolio Monitor dataset as of November 17, 2026. Q3 2026 financial figures — revenue, segment revenue, consolidated and segment gross profit, Volkswagen joint-venture revenue, net loss, adjusted EBITDA, free cash flow, capital expenditure, cash and liquidity, and full-year guidance — are taken from Rivian’s Form 8-K earnings release for the quarter ended September 30, 2026, filed with the SEC on October 29, 2026. Trailing twelve-month margin and balance-sheet ratios are from the monitor’s fundamentals set. Individual analyst targets and dates are compiled from the dated research notes listed in Sources. The IPO offer price of $78 and first-day opening price of $106.75 are from the November 2021 listing record. Shares outstanding of approximately 1.46 billion is derived from market capitalisation divided by share price and is not a reported figure; it is labelled as derived wherever used. Runway figures divide liquidity by a single quarter’s free cash flow and are deliberately crude. Scenario probabilities are our own estimates.
Sources
- Rivian Automotive, Inc., Form 8-K, Exhibit 99.1 — Third Quarter 2026 Financial Results, filed with the U.S. Securities and Exchange Commission, October 29, 2026.
- Rivian Automotive, Inc., “Rivian Releases Third Quarter 2026 Financial Results,” company newsroom, October 29, 2026.
- Rivian Automotive, Inc., Q3 2026 earnings conference call, October 29, 2026.
- CNBC, “Rivian third-quarter earnings beat estimates as software revenue, R2 deliveries rise,” October 29, 2026.
- UBS, Joseph Spak, rating change on Rivian Automotive from Neutral to Buy with a $17 price target, November 2, 2026, as reported by CNBC.
- Dated analyst actions from Morgan Stanley, RBC, TD Cowen (July 31, 2026), Yorkville Ives (October 6, 2026), Needham and Cantor Fitzgerald (October 30, 2026), DA Davidson (November 6, 2026), Stifel (November 9, 2026), Citigroup (November 10, 2026) and StoneX (November 17, 2026), compiled from published research summaries.
- IPO Portfolio Monitor, iposight.com, dataset as of November 17, 2026.
- Rivian Automotive, Inc. IPO prospectus and listing record, November 10, 2021.
iposight.com — for informational purposes only, not investment advice. No position in any security mentioned.
Discover more from IPOSight
Subscribe to get the latest posts sent to your email.