
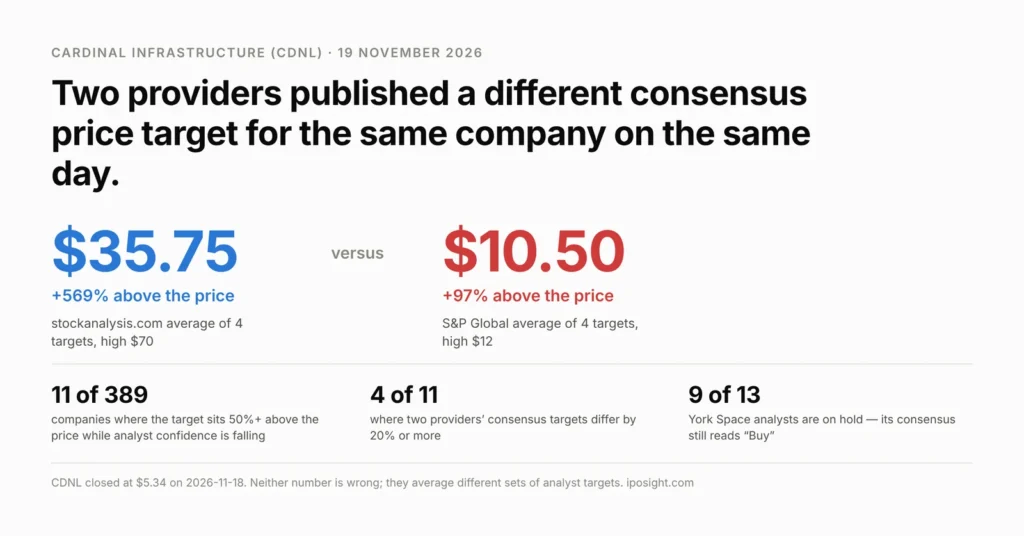
On 19 November 2026 two data providers published a consensus analyst price target for the same company, Cardinal Infrastructure (CDNL), on the same day. One said $35.75. The other said $10.50. The stock closed at $5.34 the evening before, so the first number reads as 569 percent of upside and the second as 97 percent. Neither provider made a mistake. They averaged different sets of analyst targets, and nothing on either page tells a reader that the other set exists. Cardinal is not an isolated case: across the 389 companies on our watchlist with at least four analysts and a share price above a dollar, eleven now show a target at least 50 percent above the price while the analysts behind that target have been quietly retreating for six months. In four of the eleven, two providers disagree by a fifth or more. The widest single target set runs from $4 to $40. The question this article answers is how to tell, in thirty seconds, whether an upside number is information or arithmetic.
The short version
- Eleven of 389 companies on the watchlist show a consensus analyst price target 50 percent or more above the share price while the analyst recommendation index has fallen at least 1.5 points in six months.
- Four of those eleven carry two materially different consensus targets today, depending on which provider you read. Cardinal Infrastructure is the extreme: $35.75 against $10.50, a 3.4-fold difference.
- The consensus lags the individual notes. Three houses cut NeuroPace to $9, $9 and $7 on 13 November. Our weekly snapshot three days later still carried $14.11. By 19 November the average had fallen to $11.13.
- The label hides the vote. All eleven read “Buy”. Nine of York Space’s thirteen analysts are on hold, and four of Artiva’s six.
- The span is the tell. Artiva’s four surviving targets run from $4 to $40; Cardinal’s from $8 to $70. A single average over a tenfold range is a weak summary of anything.
Part 1: What an analyst price target is, and what the published average leaves out
An analyst price target is one person’s model output: where a named analyst at a named firm expects a share to trade at a stated horizon, usually twelve months. It is published alongside a rating, it is revised when that analyst revisits the model, and between revisions it does not move. That last property is the one that matters here and the one most screens obscure.
What a data provider shows as “the” price target is almost never a single analyst’s number. It is an average over a set, and three decisions determine what comes out: which analysts are in the set, how long a target is allowed to stay in it after publication, and which vendor assembled it. None of those three decisions is visible on the page a retail investor reads. The result is a single tidy figure, often rendered beside a green percentage, that behaves as though it were a measurement when it is a summary statistic with unstated parameters.
NeuroPace (NPCE) shows the mechanism with dates attached. On 13 November 2026 three houses cut the stock on the same day: J.P. Morgan to Hold with the target moving from $20 to $9, Wells Fargo to Equal Weight from $19 to $9, and Leerink Partners to Hold at $7. Lake Street cut a $20 target to $13. The shares fell 37.1 percent that day. Our own weekly data run three days later, on 16 November, still carried a consensus target of $14.11, because the cuts had not yet propagated into the average we read. By 19 November the same source showed $11.13. The consensus had fallen 21 percent in three days without a single new note being published in between.
Read that sequence again, because it is the whole argument. The individual targets moved on 13 November. The consensus moved somewhere between the 16th and the 19th. An investor screening on upside at any point in that window was looking at a number that three analysts had already repudiated. And the propagation is not finished even now: the S&P Global set for NeuroPace still contains a $22 target, which is 2.7 times today’s price and nearly three times the lowest target in the same set.
Part 2: The eleven companies where the analyst price target says cheap and the analysts say otherwise
We screen the watchlist for a specific contradiction rather than for cheapness. The filter is mechanical. A company qualifies when its consensus target sits at least 50 percent above the share price, and the analyst recommendation index — the ratio of buy to hold to sell ratings, expressed as a single score by our data source — has fallen by at least 1.5 points over six months. The first condition says the published number looks attractive. The second says the people who produced it have been moving the other way. We also require at least four analysts and a share price above one dollar, which removes names where one note is the entire sample and names facing an exchange minimum-price problem.
On the data as of 2026-11-18 for prices and 2026-11-16 for the weekly measures, 389 companies were evaluable and eleven passed. That is 2.8 percent of the field, which is the point: this is a narrow, identifiable condition, not a description of the market.
| Ticker | Company | Price | Consensus target | Implied upside | Index change, 6m | Ratings |
|---|---|---|---|---|---|---|
| ARTV | Artiva Biotherapeutics | $3.77 | $20.75 | +450% | -5.83 | 2 buy / 4 hold |
| SUJA | Suja Life | $6.57 | $12.40 | +89% | -4.43 | 3 buy / 3 hold / 1 sell |
| CDNL | Cardinal Infrastructure | $5.34 | $35.75 | +569% | -4.00 | 3 buy / 2 hold |
| YSS | York Space Systems | $3.78 | $9.75 | +158% | -3.42 | 4 buy / 9 hold |
| NPCE | NeuroPace | $8.22 | $11.13 | +35% | -3.38 | 6 buy / 4 hold |
| SERV | Serve Robotics | $2.40 | $8.18 | +241% | -2.86 | 5 buy / 2 hold |
| TDUP | ThredUp | $1.74 | $2.80 | +61% | -2.86 | 4 buy / 3 hold |
| MNTN | MNTN | $4.61 | $11.61 | +152% | -2.50 | 6 buy / 5 hold |
| FRMI | Fermi | $2.46 | $11.93 | +385% | -2.00 | 7 buy / 2 hold |
| MBLY | Mobileye Global | $5.21 | $10.55 | +102% | -1.83 | 10 buy / 11 hold / 1 sell |
| OTLY | Oatly Group | $7.31 | $9.50 | +30% | -1.71 | 3 buy / 2 hold |
Prices 2026-11-18. Targets and rating counts from stockanalysis.com, read 2026-11-19. Index change from our weekly run of 2026-11-16.
Aardvark Therapeutics qualified on Monday and does not appear here. Its shares closed at $0.91 on 2026-11-18, below the one-dollar floor the screen applies, so it dropped out between the two measurements. Its target set still showed $4.57 against that price. A screen that ignored the floor would have returned a 402 percent upside on a stock with a listing problem, which is a reasonable illustration of why the floor is there.
Two names in the table have been covered here before. Cardinal Infrastructure was examined in our analysis of its post-IPO valuation, and Suja Life in our piece on its fall from the offer price. Both have moved since, and both moved in the direction the index was already pointing.
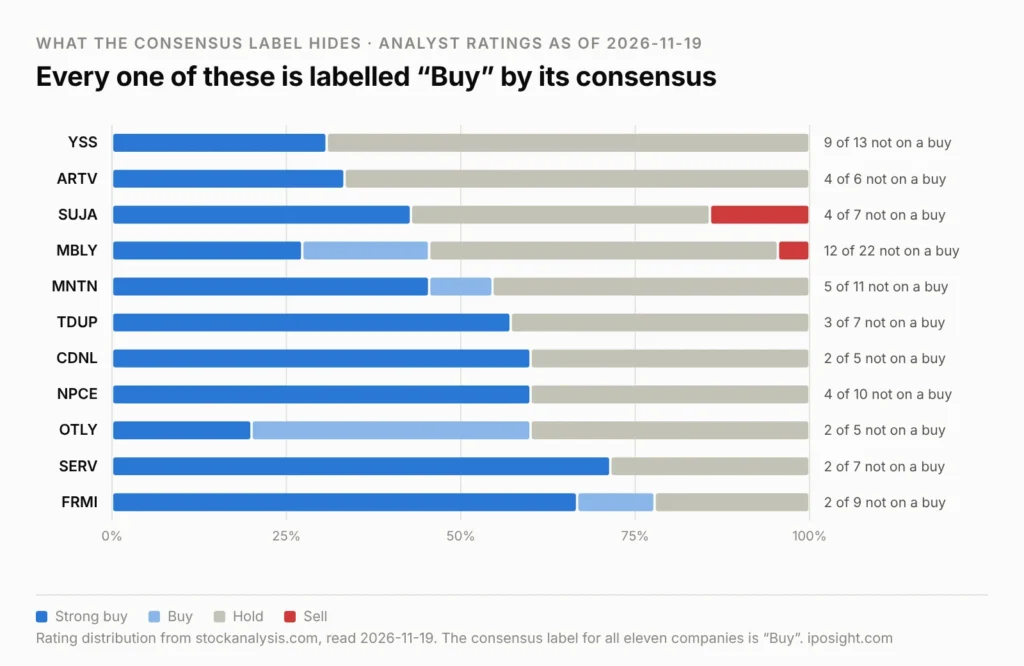
The rating distribution is worth sitting with. Every one of the eleven is labelled “Buy” by its consensus. In York Space Systems, nine of thirteen analysts are on hold. In Artiva Biotherapeutics, four of six. In Mobileye, twelve of twenty-two are on hold or selling. The label is produced by a scoring rule applied to the distribution, and a distribution with a strong minority of enthusiasts and a large bloc of fence-sitters can clear the threshold for “Buy” without a majority holding that view. Nothing improper is happening. The summary simply discards the information that would make it useful.
Part 3: Where two providers publish different analyst price targets on the same day
The sharpest version of the problem is not staleness but provenance. For four of the eleven, two widely used providers published consensus targets that differ by a fifth or more on 19 November 2026.
| Ticker | Provider A average | Provider B average | Difference | Upside, A | Upside, B |
|---|---|---|---|---|---|
| CDNL | $35.75 | $10.50 | 3.4× | +569% | +97% |
| OTLY | $9.50 | $14.50 | 1.5× | +30% | +98% |
| FRMI | $11.93 | $15.63 | 1.3× | +385% | +535% |
| MNTN | $11.61 | $9.67 | 1.2× | +152% | +110% |
Provider A is stockanalysis.com’s own target average; Provider B is the S&P Global set shown on the same page. Both read 19 November 2026 against the 18 November close.
Cardinal Infrastructure is the extreme. One set holds four targets running from $8 to $70 and averages $35.75. The other holds four targets running from $8 to $12 and averages $10.50. Both sets contain four targets. Both are described as the consensus. The $70 figure is doing almost all of the work in the first average, and whether a reader sees it is decided by which site they happened to open.
Oatly (OTLY) runs the other way: the narrower set averages $9.50 across three targets with a $10 high, while the broader set averages $14.50 across five with a $27 high. Fermi (FRMI) shows $11.93 against $15.63, with highs of $18.56 and $35. MNTN shows $11.61 against $9.67. In each case the disagreement is not about the company. It is about inclusion.
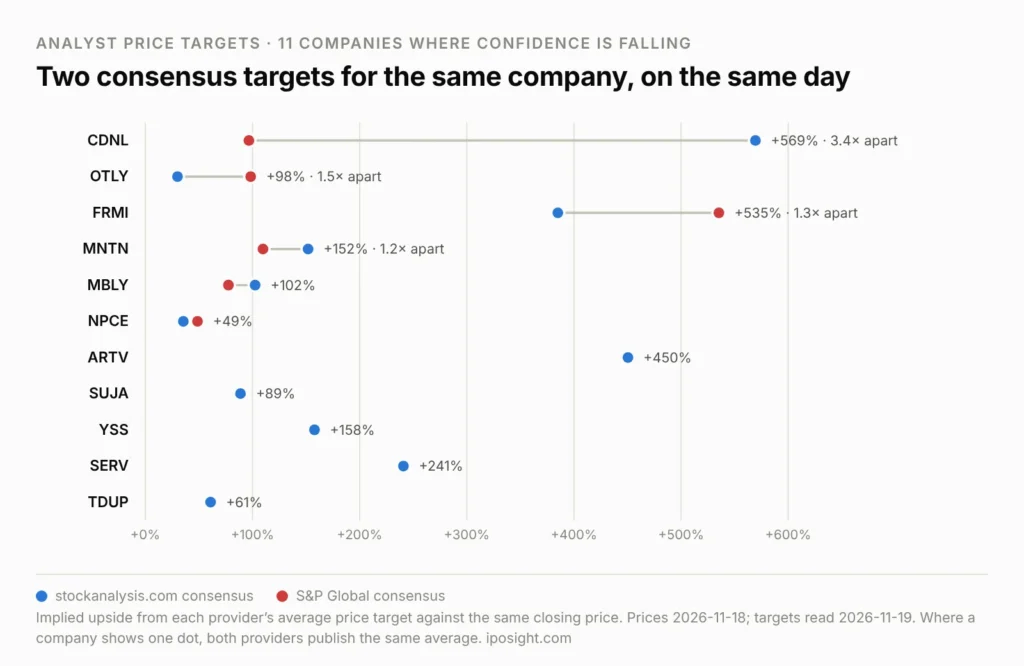
For the remaining seven the two providers agree exactly, which is itself informative: the disagreement is concentrated in companies with small, thinly maintained target sets, where one stale outlier can move an average by multiples. Mobileye, with nineteen targets in one set and twenty-three in the other, differs by 14 percent. Cardinal, with four in each, differs by 240 percent.
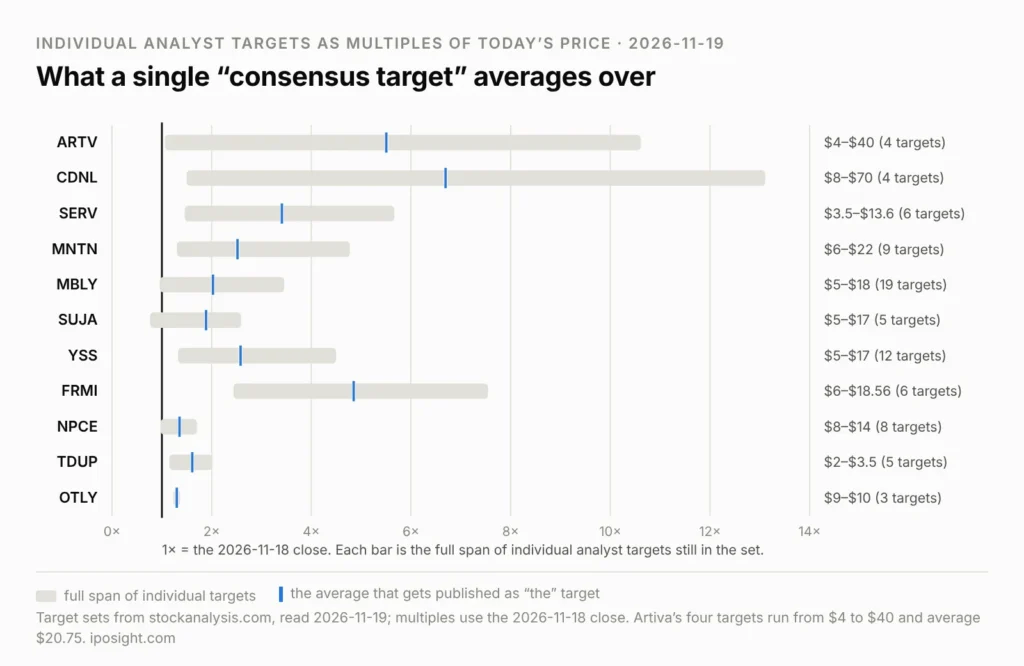
The span chart makes the structural point without any interpretation. Artiva’s four surviving targets run from $4 to $40, a tenfold range, and the published average of $20.75 sits in the middle of a hole. Cardinal’s run from $8 to $70. Serve Robotics spans $3.50 to $13.60. Where the span is tight — Oatly at $9 to $10, NeuroPace at $8 to $14 — the average is a reasonable summary. Where it is not, the average is a number with a decimal point and very little else.
Part 4: What deserves a second look
Three of the eleven survive the screen’s own criticism, for different reasons. None of this is a recommendation, and none of it should be read as one; what follows is the conditions under which each case would be worth a reader’s own work.
Mobileye (MBLY) carries the broadest coverage in the group by a wide margin: nineteen targets in one set and twenty-three ratings in the other, against a $4.7 billion market capitalization. A wide target span in a six-analyst name can be one stale note. In a twenty-three analyst name it is a genuine spread of view, and the resulting average is a far better-supported number. The condition to check is whether the index decline of 1.83 points reflects a thesis changing or a sector re-rating that has already happened in the price, which is down 39.8 percent over three months.
NeuroPace (NPCE) is the one case in the group where the consensus has visibly caught up. The three cuts on 13 November are now in the average, which has fallen from $14.11 to $11.13, and the recency-filtered subset gives $10.25. The gap to the price is the smallest in the table at 35 percent on one provider and 49 percent on the other. Whatever a reader concludes, they are now looking at a number that reflects what analysts currently think rather than what they thought a month ago. The open question is the balance sheet: debt to equity of 588.5 percent and a net margin of minus 19.3 percent, against revenue growth of 25.1 percent.
Cardinal Infrastructure (CDNL) is the only profitable company in the group, at a 2.7 percent net margin with revenue up 113.9 percent year on year. It is also the company whose two published consensus targets differ by 3.4 times, which means a reader cannot take either number at face value and has to go to the individual notes. That is more work, and it is the work the average was supposed to save.
Part 5: What to be wary of
Artiva Biotherapeutics (ARTV) carries the largest nominal upside in the group after Fermi and the worst index decline on the entire watchlist at 5.83 points. Its target set has not been revised since 29 October 2026, twenty-one days before this was written, and still contains a $40 target against a $3.77 share price. Revenue is down 100 percent year on year. Four of its six analysts are on hold. Each of those facts is public; the 450 percent upside figure is what a screener shows instead of them.
Fermi (FRMI) shows the largest upside in the table on either provider, at 385 percent and 535 percent. It also carries our thin-liquidity flag and a heavily indebted balance sheet, and its two providers disagree by 31 percent with high targets of $18.56 and $35. A nominal upside this large in a company this illiquid is a statement about the spread between an old model and a current price, not about the distance to a realistic outcome.
Serve Robotics (SERV) is pre-revenue. Any target in its set is a discounted view of a business that does not yet have a top line, which is a legitimate way to value an early company and a poor input to a cross-sectional upside screen. Clinical-stage biotech and pre-revenue technology fail every revenue-based test by construction, and treating a wide target span in those names as evidence of mispricing confuses a modeling convention with a market inefficiency.
York Space Systems (YSS) illustrates a separate trap, and it happened this week. On 13 November 2026 Jefferies downgraded the stock to Hold and cut its target from $15 to $6. The next day, 14 November, Canaccord Genuity upgraded it to Buy — and cut its target from $13.50 to $9. Two houses, two days, opposite rating moves, and both lowered the number. An upgrade that arrives with a target cut is not a statement that the business improved. It is a statement that the price fell further than the lowered model.
Part 6: The biggest risks in reading this screen
The screen has four weaknesses a reader should hold against it. First, the recommendation index is backward-looking by construction: it measures what analysts have already done, so it will always identify a retreat after the retreat. It cannot anticipate one.
Second, a wide target span is not automatically evidence of a bad company. Early-stage businesses with genuinely uncertain outcomes produce wide spans honestly. The span tells a reader how much the average is hiding, not which direction the truth lies in.
Third, small sets are fragile in both directions. In a four-analyst name, one house publishing a new note can move the consensus by 30 percent overnight, which means these figures can be right today and misleading on Monday. That is an argument for checking the date on the set rather than for ignoring it.
Fourth, our own data is subject to the same lag we are describing. The consensus targets in our weekly run are refreshed once a week while prices update daily, which is exactly how the NeuroPace figure of $14.11 survived three days past the cuts that invalidated it. We have published that gap here rather than quietly correcting it, because a reader who understands the mechanism can allow for it and a reader who does not cannot.
Part 7: The thirty-second check, and the dates that would settle it
The whole of this article reduces to four questions a reader can answer on any stock page in well under a minute, without taking anyone’s word for the summary.
- How many targets are in the set, and when was the newest one published? A set of four that has not moved in three weeks is not a consensus; it is an archive.
- What is the low and the high? If the high is more than three times the low, the average is a midpoint between incompatible views rather than a central estimate.
- How do the ratings actually split? Count the holds. A “Buy” label over a majority of holds is a scoring artifact.
- Does a second provider agree? Open one other source. If the two consensus figures differ by more than a fifth, neither is usable without going to the individual notes.
Four of the eleven have earnings dates inside the next two weeks, which is the event most likely to force a revision of the sets described here: Klarna and Viking Holdings on 17 November have already reported, Mobileye’s and ThredUp’s sets are the ones most likely to be rebuilt next. A target set is revised when an analyst has a reason to open the model, and a results release is the most reliable reason there is. Where a set is three weeks old and no results are scheduled, it is likely to stay three weeks old.
Final Verdict
What is factually established here is narrow and checkable. Eleven of 389 watchlist companies show a consensus analyst price target at least 50 percent above the share price while the analyst recommendation index has fallen 1.5 points or more in six months. In four of those eleven, two providers published materially different consensus figures on 19 November 2026, with Cardinal Infrastructure differing by 3.4 times. All eleven are labelled “Buy”, and in four of them a majority of the covering analysts are not on a buy rating.
For any of these upside figures to be information rather than arithmetic, three things have to be true at once. (1) The target set has to be current, which means at least one target published after the most recent material event at the company. (2) The span between the lowest and highest surviving target has to be narrow enough that the average means something, which in practice means a high no more than about three times the low. (3) The rating distribution has to support the label, which means a majority of the covering analysts actually holding a buy rating rather than a scoring rule clearing a threshold. On the data as of 19 November 2026, NeuroPace satisfies the first, Oatly and NeuroPace the second, and Fermi, Serve Robotics, ThredUp and Cardinal the third.
The case against treating any of this as a screen for undervaluation is strong and should be stated plainly. Every company in the table is there because analysts have been retreating from it, and analysts retreat for reasons that are usually visible in the filings. Artiva’s revenue is down 100 percent. Fermi is heavily indebted and thinly traded. Serve Robotics has no revenue. A large gap between price and target in these names is at least as likely to resolve by the target falling as by the price rising, and in NeuroPace this week it resolved by the target falling 21 percent in three days.
The broader point outlasts these eleven names. A consensus price target is a summary statistic whose parameters are not published: the membership of the set, the age of its members and the identity of the vendor. When those parameters are benign, the number is a useful shorthand for what the informed sell side expects. When they are not, the same number becomes a mechanical reflection of how far a share price has fallen since anyone last opened the model. The two look identical on screen, and the only way to tell them apart is to ask the four questions above.
Frequently asked questions
What is a consensus analyst price target?
It is the average of the individual twelve-month price targets published by the analysts covering a stock. It is not a forecast produced by any single person, and the result depends on which analysts are included and how long their targets are allowed to remain in the set after publication.
Why do two websites show different price targets for the same stock?
Because they average different sets. Providers differ in which brokers they license, how quickly they ingest a revision and how long they keep a target before dropping it as stale. On 19 November 2026 two providers showed $35.75 and $10.50 for Cardinal Infrastructure, both labelled as the consensus, both containing four targets.
Does a high upside to the price target mean a stock is cheap?
Not on its own. The figure is a ratio between two numbers that move at completely different speeds: the price changes every day, the target changes only when an analyst republishes. A large gap can mean the market is wrong, or it can mean the target has not been revised since the market changed its mind.
How quickly does the consensus target update after a downgrade?
Slower than the individual notes. Three houses cut NeuroPace on 13 November 2026 to $9, $9 and $7. The consensus we read on 16 November was still $14.11, and by 19 November it had fallen to $11.13 — a 21 percent move with no new notes published in between.
What does it mean when an analyst upgrades a stock but cuts the price target?
It usually means the share price has fallen further than the analyst’s reduced estimate of value, not that the business improved. Canaccord Genuity upgraded York Space Systems to Buy on 14 November 2026 while cutting its target from $13.50 to $9.
Can a stock have a “Buy” consensus when most analysts are on hold?
Yes. The label comes from a scoring rule applied to the rating distribution, and a minority of strong buys can outweigh a larger bloc of holds. Nine of York Space Systems’ thirteen analysts are on hold and its consensus still reads Buy.
Methodology. The screen runs on the IPOSight watchlist of 470 listed companies. A company is evaluable when it carries at least four analyst ratings, trades above $1.00 and is not under acquisition; 389 qualified. A company enters the cohort when its consensus target is at least 50 percent above the share price and the analyst recommendation index has fallen 1.5 points or more over six months, which is the same threshold our watchlist uses for its “weakening confidence” flag. Share prices are closing prices for 2026-11-18. The recommendation index and its six-month change come from our weekly run of 2026-11-16. Consensus targets, individual target ranges, target counts, set revision dates and rating distributions were read from stockanalysis.com on 2026-11-19, where two sets are published side by side: the site’s own average and an S&P Global average. Implied upside is the target divided by the closing price, less one. Rating moves and their dates are as reported by the covering brokers and carried in our weekly event feed; where a source gave a new rating without the previous one, only the new one is stated. Aardvark Therapeutics met the cohort conditions on 2026-11-16 and is excluded because its 2026-11-18 close of $0.91 fell below the screen’s price floor. No figure in this article is estimated. Our scoring method is described at /method/.
Sources. 1. stockanalysis.com company forecast pages for ARTV, SUJA, CDNL, YSS, NPCE, SERV, TDUP, MNTN, FRMI, MBLY and OTLY, read 19 November 2026 — consensus targets, target ranges, target counts, set revision dates, S&P Global comparison sets and rating distributions. 2. IPOSight watchlist weekly run, 16 November 2026 — recommendation index and six-month change, fundamentals, flags. 3. IPOSight daily price refresh, 18 November 2026 — closing prices. 4. Broker rating actions as reported 13–14 November 2026: J.P. Morgan, Wells Fargo, Leerink Partners and Lake Street on NeuroPace; Jefferies and Canaccord Genuity on York Space Systems.
iposight.com — for informational purposes only, not investment advice. No position in any security mentioned.
Discover more from IPOSight
Subscribe to get the latest posts sent to your email.