
IPO Winners and Losers | Earned Gains vs Hype | 2026 Year to Date
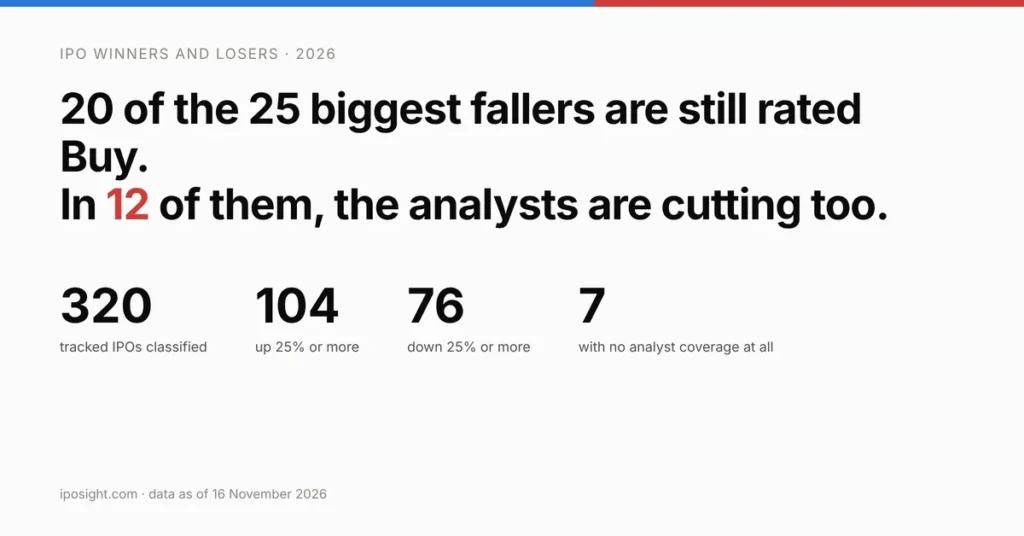
Three of the twenty-five biggest gainers among the IPOs we track have no analyst coverage at all. One of them, up 1,471% this year, trades at 908 times earnings on $11.1 million of revenue. At the other end, twenty of the twenty-five biggest fallers still carry a Buy consensus — which looks like a list of bargains until you notice that in twelve of them the analysts are cutting too, and the target price simply has not been rewritten yet. This is the whole problem with reading winners and losers off a price screen: the same number means opposite things depending on what the business and the analysts did underneath it. We sorted all 320 companies with a full year of prices into six buckets using one published rule, and the uncomfortable answer is that genuine dislocation is far rarer than the target-price column suggests.
The short version
- Of 320 tracked IPOs with a full calendar year of prices and a market value above $300 million, 104 are up 25% or more this year and 76 are down 25% or more. The median company is up 4.0%.
- 41 of the risers grew revenue 15% or faster while they rose — the gain and the business moved together.
- 21 risers have gone past their own analysts: the share price now sits at or above the consensus target. Cricut (CRCT) is 45% above a target set by a Strong Sell consensus.
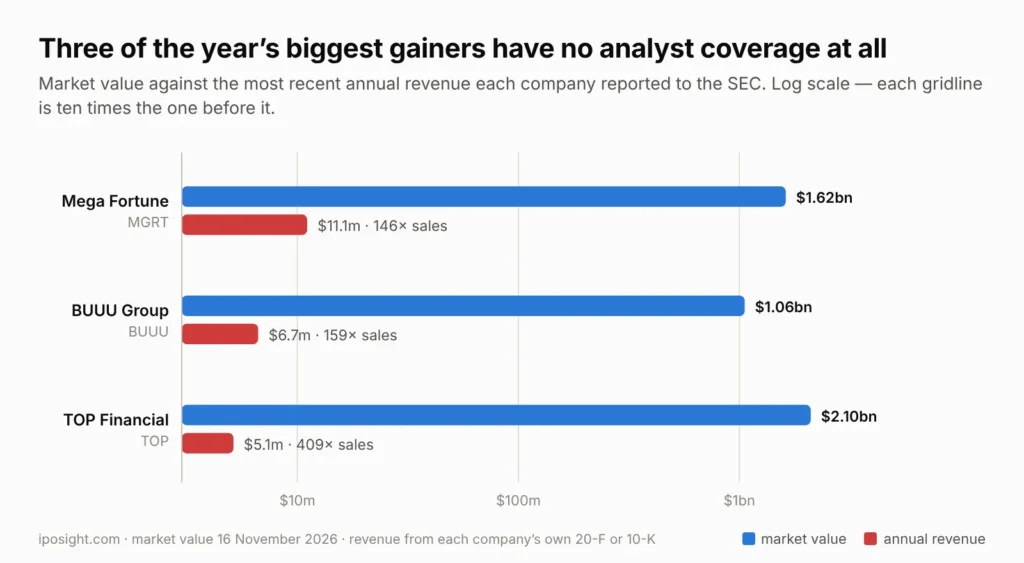
- Seven companies in the set have no analyst coverage whatsoever. Three of them are among the year’s largest gainers, and their own SEC filings show $11.1m, $6.7m and $5.1m of annual revenue against market values of $1.6bn, $1.1bn and $2.1bn.
- Among the fallers, 33 are what we call ORPHANED — still rated Buy, but with a falling recommendation index. The large target gap is a stale number, not an opportunity.
- 29 qualify as DISLOCATED, and only 16 of those have analysts actively moving toward them. That is 5% of the universe, not a shopping list.
- The 2026 class is the weakest part of the market: 71% of this year’s listings trade below their first-day opening price, median −14.9%, while 93% still carry a Buy or Strong Buy consensus.
- Every figure here is reproducible from our own Scores page and the filings linked at the end.
The rule we used, so you can run it yourself
A price change on its own says nothing about whether it was deserved. We combined three things we already publish for every company: the move, what the business did underneath it, and what the analysts did while it happened.
The third input is the one most screens omit. Our recommendation index is a single number built from the distribution of analyst ratings, and what matters here is not its level but its change over six months. A stock can be rated Buy by consensus while every house that touched it recently moved the other way. That is the most useful early signal in this dataset, and it separates the two groups of fallers below.
The buckets, in full:
| Label | Condition | Count |
| CONFIRMED | Up 25%+ and revenue growing 15%+ year on year | 41 |
| OVEREXTENDED | Up 25%+ and the price is now within 5% of, or above, the consensus target | 21 |
| CROWDED | Up 25%+ with flat or shrinking revenue, outside biotech | 4 |
| DIVERGING | Up 25%+ with growth between zero and 15% | 16 |
| Clinical-stage | Up 25%+, pre-revenue biotech — judged separately, see below | 19 |
| DISLOCATED | Down 25%+, Buy consensus, recommendation index not falling, target 30%+ above the price | 29 |
| ORPHANED | Down 25%+, Buy consensus, but the recommendation index is falling | 33 |
| JUSTIFIED | Down 25%+ and the consensus has already moved to Hold or Sell | 11 |
| No coverage | No analyst follows the company at all | 7 |
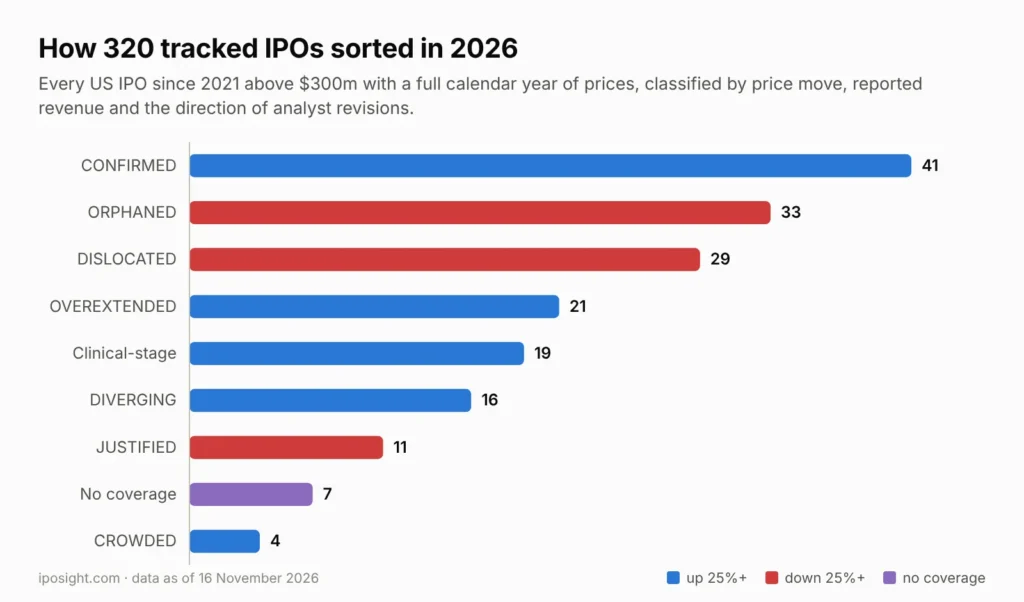
One deliberate exception: nineteen risers are clinical-stage biotechs with no product revenue, and a revenue test would label every one of them a hype case. Having no revenue is the normal condition of a company whose entire value is a pipeline, so we pulled them out and judged them on coverage depth and the index instead. Our full data method is on the Method page.
Part 1: The 2026 IPO winners that earned it
Forty-one companies rose at least 25% while growing revenue at least 15%. It is the least dramatic group here and the largest, which is itself the finding: most of the year’s big gains came with a business behind them.
| Company | Year to date | Revenue growth | Net margin | Analysts |
| Hinge Health (HNGE) | +148.4% | +50.6% | 21.0% | 17 |
| Andersen Group (ANDG) | +131.6% | +23.7% | 3.7% | 8 |
| Oscar Health (OSCR) | +116.1% | +27.5% | 4.9% | 11 |
| SharkNinja (SN) | +102.3% | +15.8% | 11.6% | 14 |
| Venture Global (VG) | +92.7% | +176.9% | 31.1% | 17 |
| BrightSpring Health (BTSG) | +90.2% | +28.2% | 2.7% | 18 |
| Marex Group (MRX) | +84.4% | +25.4% | 8.9% | 9 |
| Zeta Global (ZETA) | +80.1% | +29.7% | 2.3% | 15 |
| DigitalOcean (DOCN) | +79.4% | +15.5% | 3.1% | 17 |
| Pattern Group (PTRN) | +76.6% | +39.3% | 3.6% | 9 |
Hinge Health is the clearest case: a 148% gain alongside 50.6% revenue growth, an 85.7% gross margin and a 21.0% net margin, with seventeen analysts still placing the target 17.3% above the price. Venture Global grew revenue 176.9% at a 31.1% net margin — we covered the quarter and the arbitration hanging over it in detail.
In all ten the consensus target still sits above the price, and in seven the recommendation index is flat or rising. A gain the analysts kept pace with looks structurally different from one they were left behind by — which is the next section.
Part 2: The winners that ran past their own analysts
Twenty-one risers have reached or passed the consensus target. That is not a prediction that they fall. It means the people who publish numbers on these companies have nothing left on the table today, so the price is above every published estimate of what the business is worth.
| Company | Year to date | Price vs target | Revenue growth | Consensus |
| Ibotta (IBTA) | +153.4% | 12.2% above | −6.8% | Hold |
| BBB Foods (TBBB) | +109.7% | 5.1% above | +36.1% | Buy |
| Ardent Health (ARDT) | +101.6% | 6.6% above | +6.0% | Buy |
| Cricut (CRCT) | +74.8% | 45.3% above | −0.5% | Strong Sell |
| Bumble (BMBL) | +67.8% | 35.9% above | −9.9% | Hold |
| Sweetgreen (SG) | +81.4% | 0.7% above | +0.4% | Buy |
Cricut is the extreme: up 74.8% with revenue down 0.5%, and the three analysts who cover it hold a Strong Sell consensus with a target 45% below where the shares trade. Ibotta rose 153.4% while revenue fell 6.8%. Bumble rose 67.8% with revenue down 9.9% and a net margin of −61.8%.
Two of the six are different in kind: BBB Foods grew 36.1%, and Sweetgreen’s index rose 2.63 over six months, so there the analysts are chasing the price and the targets will likely be revised. The mechanism to hold on to: once a price passes every published estimate, the next move depends on estimates being raised, and estimates get raised by results, not by momentum.
Part 3: Where there is nothing left to value
Seven companies in our set have no analyst coverage at all. Three of them are among the year’s largest gainers. No coverage does not mean no information — all three are SEC registrants and all three file. So we read the filings.
Mega Fortune (MGRT), up 1,471% this year. The company sold 3,750,000 ordinary shares at $4.00 on 16 July 2025 and trades at $118.00 today, a gain of 2,850% against the offer. Its annual report for the year to 30 September 2025 reports revenue of $11.09 million, up 233%, and net income of $1.79 million. With 13,750,000 shares outstanding, the $1.62 billion market value works out at 908 times earnings, 146 times revenue and 104 times book value. The prospectus also states that one British Virgin Islands holding company owns 72.73% of the shares after the offering, leaving a free float of roughly 3.75 million shares. The annual report was preceded by a Form NT 20-F — a notification that the filing would be late.
BUUU Group (BUUU), up 729% this year. Also an August 2025 listing at $4.00, for 1,500,000 Class A shares representing 13.04% of the Class A stock after the offering. Allowing for the ten-for-one share split since, the offer price is equivalent to $0.40 against today’s $5.32. The annual report for the year to 30 June 2026 shows revenue of $6.65 million, up 5.1%, and a net loss of $4.83 million against a $0.79 million profit the year before. Gross profit fell from $1.96m to $1.13m. At a $1.06 billion market value that is 159 times revenue, and there is no earnings multiple because there are no earnings.
TOP Financial Group (TOP), up 238% this year — and the most instructive of the three, because the filings explain the share count rather than the price. In March 2026 the company agreed a private placement of units at $0.37308 per unit, each unit one Class A share plus two warrants; the placement closed on 9 July 2026 with 214,431,222 shares issued. A five-for-one reverse share split took effect on 3 August 2026, making the placement price equivalent to $1.8654 per current share. All the warrants have since been exercised. On 8 October 2026 the company registered the resale of up to 98,179,613 shares — 79.4% of the 123.7 million shares outstanding. The stock trades at $17.00, 9.1 times the placement price. The business behind it earned $5.14 million of revenue over the last twelve months and lost $1.20 million, which puts the $2.10 billion market value at 409 times revenue.
We are not describing fraud and not forecasting anything. The arithmetic is the point: a company with no analyst coverage, a small free float and a very large registered resale is a security priced by flow rather than by estimates, because there are no estimates. That is a different instrument from the one most readers assume they are looking at when a tracked IPO tops a performance list.
Part 4: The IPO losers, and the stale-target trap
Seventy-six companies are down 25% or more. Sixty-two of them — four out of five — still carry a Buy or Strong Buy consensus. Run a screen for “big fall, still rated Buy, large gap to target” and you get a list that looks like a season of opportunities. The list is mostly an artifact.
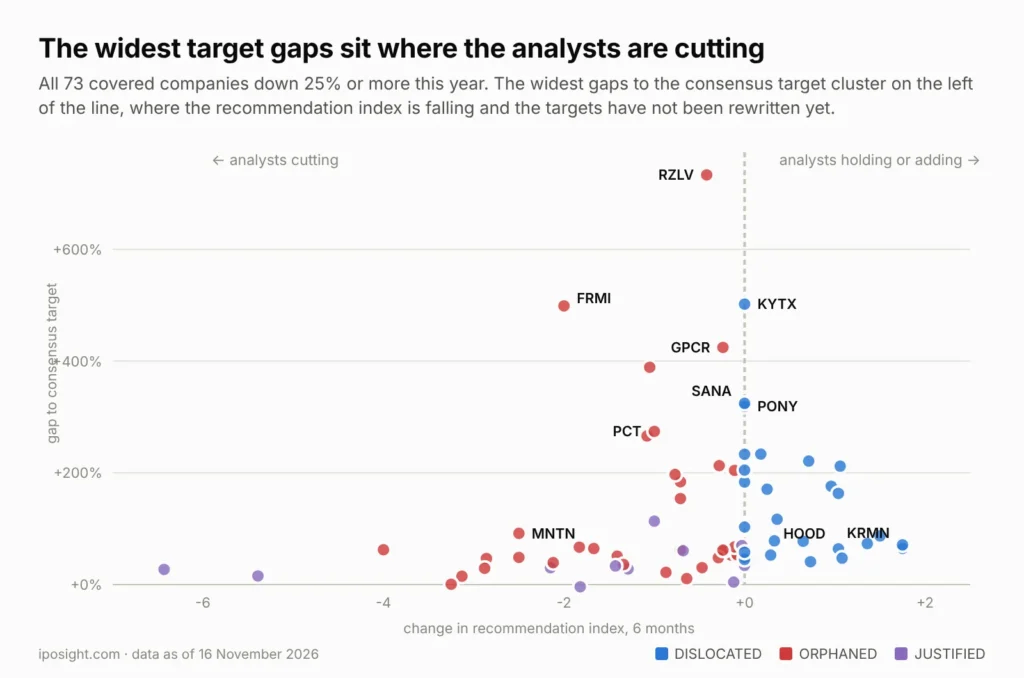
The reason is mechanical. When a stock falls hard, the consensus rating and the target price do not move at the same speed. Analysts downgrade one at a time over weeks, while the published target stays where it was set until each house republishes its model. For months, then, a collapsing stock can display a Buy consensus and a target 200% or 400% above the price — not because anyone expects a triple, but because nobody has rewritten the number. The recommendation index catches this, because it moves as soon as the first houses cut. Splitting the 76 on that single test separates them cleanly:
| Company | Year to date | Gap to target | Index, 6 months | Reading |
| PureCycle (PCT) | −80.2% | +274.3% | −1.00 | ORPHANED |
| Fermi (FRMI) | −67.4% | +498.9% | −2.00 | ORPHANED |
| Rezolve AI (RZLV) | −53.3% | +733.3% | −0.42 | ORPHANED |
| Structure Therapeutics (GPCR) | −71.2% | +424.3% | −0.24 | ORPHANED |
| MNTN (MNTN) | −57.8% | +91.9% | −2.50 | ORPHANED |
| Reddit (RDDT) | −57.2% | +50.8% | −1.41 | ORPHANED |
| Karman Holdings (KRMN) | −44.4% | +64.8% | +1.75 | DISLOCATED |
| Robinhood (HOOD) | −31.2% | +64.1% | +1.04 | DISLOCATED |
| Figma (FIG) | −48.0% | +40.9% | +0.73 | DISLOCATED |
Now look at the widest gaps in the whole falling cohort. Of the ten largest, six belong to companies whose recommendation index is falling, and three to companies where it has not moved at all in six months. Exactly one has analysts moving toward it, and that one by 0.18 of a point. The gap is large precisely because the fall was violent and the models have not caught up: Rezolve AI’s 733% rests on four analysts, and Fermi’s 499% sits on an index down two full points.
We can date how fast these numbers rot. On 13 November our own calendar recorded a 207% target gap for Cerebras (CBRS) and 278% for Fervo Energy (FRVO). Three days later the same two gaps read 93% and 156% — because the shares rose 21.2% and 27.5% in a week. A target gap is a snapshot of two numbers moving at different speeds, and the slower one is usually the target.
Part 5: What deserves a second look
Twenty-nine companies passed the DISLOCATED test. One of them, Lyell Immunopharma (LYEL), has already risen 74.6% in a month and is no longer dislocated on any reading, leaving 28. Those 28 split again, and the second split matters more than the first. In 16 the recommendation index is actively rising: analysts moved toward the company while the price fell. In the other 12 it is exactly flat — nobody downgraded, nobody upgraded. An unchanged index is the absence of evidence, not evidence of support.
| Company | Year to date | Index | Revenue growth | Net margin | Analysts |
| Karman Holdings (KRMN) | −44.4% | +1.75 | +36.6% | 7.5% | 14 |
| Figure Technology (FIGR) | −38.2% | +1.50 | +55.7% | 33.7% | 10 |
| Robinhood (HOOD) | −31.2% | +1.04 | +51.6% | 39.0% | 32 |
| IREN (IREN) | −51.9% | +1.06 | +41.1% | −194.4% | 20 |
| CoreWeave (CRWV) | −25.8% | +0.36 | +167.9% | −25.6% | 41 |
| StubHub (STUB) | −60.8% | +1.36 | −1.4% | −91.3% | 14 |
Three of these are profitable and growing at once: Karman, Figure Technology and Robinhood each pair double-digit revenue growth with a positive net margin and an index rising a full point or more, and Robinhood’s signal rests on 32 analysts rather than a handful.
The other three are not the same thing. IREN grew revenue 41.1% at a −194.4% net margin and fell a further 40.2% last month; CoreWeave grew 167.9% and still loses money; StubHub’s index rises while revenue shrinks 1.4% at a −91.3% margin. There the analysts are backing a forward model, not a current result — the difference between the two halves of this table is the difference between cheap and early.
The twelve with an unchanged index are the ones to treat most carefully, because they carry the most eye-catching numbers: Kyverna (KYTX) shows a 502% target gap, Sana Biotechnology (SANA) 324%, Pony AI (PONY) 319%, Ivanhoe Electric (IE) 205%. In every one of those the index has not moved at all in six months. No house has defended the number and no house has withdrawn it.
Part 6: What to be wary of
Beyond the ORPHANED group, two things in the wider data are worth naming.
The worst outcomes cluster below the size line. Our engine carries two terminal-case flags, junk zone and value trap, covering nine companies across the full 470 we track. Not one is in this article’s 320: every one is too small for the $300 million floor, and eight of the nine are below $140 million. MDxHealth (MDXH) is down 96.0% this year at a $14 million market value, Aardvark Therapeutics (AARD) down 89.9% at $29 million. All four junk-zone companies have already been moved to a Hold consensus — the analysts stopped recommending them before the price finished falling. The size threshold used here is not a convenience: it removes the part of the distribution where the real destruction happens.
The large caps where the analysts turned first. This is the most expensive version of the trap, because the names are familiar. AppLovin (APP) is down 39.3% with a recommendation index down 0.64 and only 10.8% left to its target, after rising 46.5% in the last month. Roblox (RBLX) is down 38.4% with an index down 3.25 and a target gap of 0.8% — the analysts have already finished moving. monday.com (MNDY), Klarna (KLAR) and Mobileye (MBLY) sit in the same group. Reddit is the sharpest case of all: revenue growing 69.4% at a 32.1% net margin, and 32 analysts cutting into it.
Part 7: The 2026 IPO class, measured separately
Companies that listed this year cannot be measured year to date, so they are measured from their first-day opening price — the level a retail buyer could actually have paid, usually well above the offer price the institutions got. Ninety-one listed in 2026; 84 clear the $300 million line with a measurable return.
- 60 of the 84 — 71% — trade below their first-day opening price. The median is −14.9%.
- 13 have at least halved from that level.
- 78 of the 84 — 93% — still carry a Buy or Strong Buy consensus.
- 27 are inside a lock-up expiry window, with four of the largest releasing on 1 December.
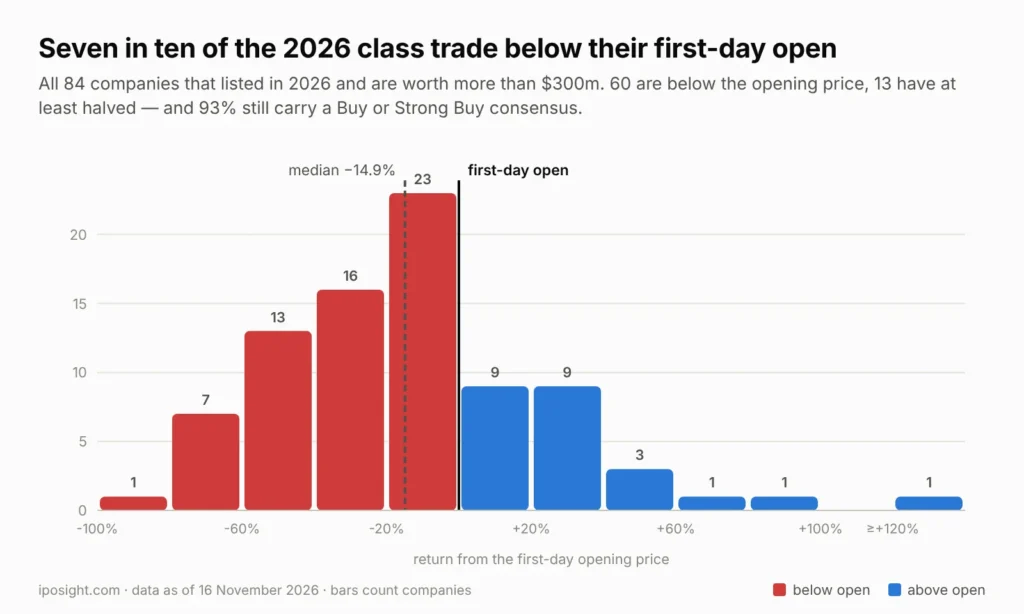
A 93% Buy rate on a cohort where seven in ten are under water is the clearest illustration of the lag described above. These are companies the same banks underwrote, with coverage initiated at prices that no longer exist.
| Company | From first open | Market cap | Analysts | Flagged |
| York Space Systems (YSS) | −84.8% | $784M | 13 | confidence falling, halved from open |
| Cerebras Systems (CBRS) | −68.9% | $26.4B | 11 | fell on sound metrics, lock-up |
| ITG (ITG) | −68.4% | $705M | 9 | fell on sound metrics, profitable |
| Fervo Energy (FRVO) | −68.0% | $3.4B | 16 | analysts held, lock-up |
| BitGo (BTGO) | −67.9% | $496M | 12 | analysts held, revenue shrinking |
| X-Energy (XE) | −63.2% | $4.5B | 11 | lock-up, halved from open |
| PicS (PICS) | −62.1% | $962M | 9 | fell on sound metrics, profitable |
| ERock (EROC) | −58.2% | $2.3B | 8 | fell on sound metrics |
| Innio (INIO) | −55.7% | $10.9B | 10 | fell on sound metrics, lock-up |
| Quantinuum (QNT) | −47.9% | $9.4B | 14 | fell on sound metrics, lock-up |
The composition is not random. Read the names rather than the sector labels and the pattern is obvious: Cerebras, Fervo, X-Energy, Quantinuum, ERock and Innio are the AI-compute, nuclear, geothermal and quantum listings — companies that came to market when those themes were at their most expensive, and which have de-rated together since.
Ten carry our fell on sound metrics flag: the decline happened without a matching deterioration in the reported numbers. That is not a verdict. It says the explanation is not in the income statement, which leaves supply, sentiment and the price paid at listing — and for 27 of these companies the supply question has a date on it. Our Key Dates page carries every expiry we can source from a filing, and we worked through the 1 December cluster separately.
The upper half of the 2026 class is thinner and more specific. Veradermics (MANE) is up 292.9% from its opening price with seven analysts and a Strong Buy consensus; Ethos Technologies (LIFE) is up 75.1% on 52.1% revenue growth; IMC Rare Earths (IMC) is up 56.6%. The largest riser by market value, Pershing Square (PS) at $17.9 billion and up 86.3%, is simultaneously the clearest OVEREXTENDED case of the new cohort: the consensus is Hold, the price sits 2.6% above the target, and the recommendation index has fallen four full points.
What these numbers do not tell you
Four limits, stated plainly.
The recommendation index measures analyst behaviour, not truth. Analysts are late as a group, they herd, and a rising index can mean a desk defending a position taken at the IPO. It beats the consensus label because it moves earlier, not because the people producing it are right.
Fundamentals are the most recently reported figures, and reporting lags price. A company that looks like it fell on sound metrics may simply not have reported the bad quarter yet. Where filings and ratios disagree, the filings win — which is why Part 3 is built from annual reports rather than screened data.
Year to date is an arbitrary window. It starts on 1 January for reasons unconnected to any of these businesses and flatters anything that bottomed in December. agilon health (AGL) is up 571.5% this year and still 83.6% below its first-day open.
Nothing here is a view on what any share price will do. The six labels describe the relationship between a price, a set of published estimates and a set of reported numbers on one date. They are a better question, not an answer.
A 30-second version you can run yourself
For any IPO that has moved a long way this year, in either direction:
- Is anyone covering it? No analysts means no estimates, and a price set by flow. Check the filings yourself before anything else.
- Which way is the recommendation index moving? Not the Buy or Hold label — the direction of change over six months. This is the one column that moves before the target does.
- Where is the price relative to the target? At or above it on a riser means the published estimates have run out. Far below it on a faller means either dislocation or a stale number, and the index tells you which.
- Did revenue move the same way as the price? For anything that is not pre-revenue biotech, this is the fastest hype test there is.
- Is there a lock-up date? For anything that listed in the last eighteen months, potential supply has a calendar entry.
All five columns are on our Scores page for every company we track, updated weekly, and the upcoming supply dates are on Key Dates and the IPO calendar.
Final Verdict
The factual picture is clear enough. The median tracked IPO rose 4.0% this year and the extremes did almost all the work. Forty-one rose with their businesses, the ordinary case. Twenty-one rose past the point where any published estimate supports the price. Three rose several hundred per cent with no published estimate in existence at all, on revenue of $11.1 million, $6.7 million and $5.1 million — and in the third case with 79.4% of the share count registered for resale six weeks ago.
For the falling side, three conditions have to hold before “it fell for no reason” is worth saying. First, the consensus must still be Buy. Second, the recommendation index must not be falling — otherwise the target gap you are looking at is a number nobody has rewritten yet. Third, the business has to be doing something: growing, or earning, or both. Sixty-two companies pass the first test. Twenty-nine pass the first two. When the third is applied strictly, the list of companies where price and substance have genuinely separated is a single-digit percentage of the universe, and three of the most convincing — Karman, Figure Technology and Robinhood — are not the ones with the eye-catching target gaps.
The case against the whole exercise deserves stating. Every input is backward-looking: reported fundamentals describe a quarter that has ended, analyst behaviour describes houses that are structurally late, and a classification built on both can only describe the position as it stands. A genuine dislocation and a company whose bad news has not yet been published look identical here. The 2026 cohort is the live test: 71% below their opening price with a 93% Buy rate is either the market being wrong about seventy companies or the sell-side being slow about seventy companies, and the next two reporting seasons will settle which.
What the exercise does establish is narrower and more useful than a list of winners and losers. The target-price column — the number most widely republished and least often examined — is the weakest input on the page, because it is the slowest to change. A 733% gap to target tells you almost nothing about a company and almost everything about how fast its price fell. The direction in which the analysts are moving tells you more, and it is free to check.
Frequently asked questions
What is the recommendation index?
A single number derived from the distribution of analyst ratings on a company — strong buys, buys, holds, sells — so that a change in the mix becomes measurable. We quote its change over the previous six months. A reading of −2.50 means the balance of published ratings has moved substantially toward the sell side in that period, even if the headline consensus still reads Buy.
Why is a large gap to the target price not a good sign on its own?
Because the two numbers move at different speeds. A consensus target is the average of individual estimates, and each changes only when that analyst republishes a model. After a sharp fall the price updates instantly and the targets over weeks or months, so the gap widens automatically. Of the ten widest target gaps in our data, six belong to companies whose recommendation index is falling and three to companies where it has not moved at all. The gap measures how fast the price dropped, not what the company is worth.
Why are the 2026 listings measured from the opening price rather than the offer price?
The offer price is where institutional allocations were struck. The opening price is the first level at which an ordinary investor could transact, and on a hot listing the two can differ by 50% or more. We hold both and default to the opening price because it reflects the outcome for the reader rather than for the book.
How does a company with no analyst coverage get a $1.6 billion market value?
Market value is price multiplied by share count, and neither input requires anyone to have published an estimate. Where the free float is small, modest buying moves the price a long way, and the market value that results is an arithmetic consequence rather than a valuation. The filings are the only hard information available: all three companies in Part 3 file annual reports with the SEC, and the figures quoted here are read from them.
Where can I see the full list?
Every company in this analysis, with its score, flags, fundamentals and analyst figures, is on our Scores page, which is rebuilt weekly. Lock-up dates are on Key Dates, upcoming listings on the Calendar, and our rule-driven simulated portfolio on Model Portfolio.
Methodology
The universe is the 470 US-listed IPOs from 2021 onward that we track. Prices are daily closes to 16 November 2026; the year-to-date figure is measured against each company’s last close of the previous calendar year, and the opening-price figure against its first close as a listed company. Where a share split or an earlier non-US listing makes a historical series unreliable, we withhold the figure rather than publish it — four companies in the set are marked this way, and their opening-price returns are omitted throughout. Analyst counts, consensus labels, target prices and the recommendation index come from the weekly run of 16 November 2026. Fundamentals — revenue growth, gross and net margin, debt to equity, current ratio — are the most recently reported figures as of the same run. The classification in this article uses a $300 million minimum market value and requires a full calendar year of prices, which leaves 320 of the 470; the 2026 cohort is measured separately on 84 companies. Revenue, net income, share counts, offer prices, split ratios and the resale registration described in Part 3 are read directly from the companies’ own SEC filings, listed below. Our full data method is on the Method page and the scoring rules on the Rules page. This article folds in a planned piece on 2026 target-price gaps; the two analyses use the same dataset.
Sources & References
[1] SEC EDGAR — Mega Fortune Company Limited, Prospectus (424B4), 16 July 2025
[2] SEC EDGAR — Mega Fortune Company Limited, Annual Report (20-F) for the year ended 30 September 2025, filed 3 February 2026, accession 0001493152-26-004907
[3] SEC EDGAR — BUUU Group Limited, Prospectus (424B4), 14 August 2025
[4] SEC EDGAR — BUUU Group Limited, Annual Report (20-F) for the year ended 30 June 2026, filed 30 October 2026, accession 0001213900-26-114422
[5] SEC EDGAR — TOP Financial Group Limited, Resale Prospectus (424B3), 8 October 2026
[6] SEC EDGAR — TOP Financial Group Limited, Annual Report (10-K) for the year ended 31 March 2026 and Quarterly Report (10-Q) for the period ended 30 September 2026
[7] iposight.com — Scores, company dataset as of 16 November 2026; prices, analyst coverage, recommendation index and reported fundamentals
[8] iposight.com — Key Dates, lock-up expiry tracker, each row sourced to its own filing
iposight.com — for informational purposes only, not investment advice. No position in any security mentioned.
Discover more from IPOSight
Subscribe to get the latest posts sent to your email.